


Introduction
Watercool HTSF2 3×120 LT 360 Radiator Review
The intention of this write up is to provide information and performance data about the Watercool HTSF2 3 x 120 LT radiator for inclusion in the Extreme Rigs Rad Round Up 2015. I’ll be keeping the review section short and factual, focusing on presenting the performance data compiled through the numerous tests carried out. First of all a big thanks to Watercool for providing this sample of the HTSF2.
![]()
What’s in the box?
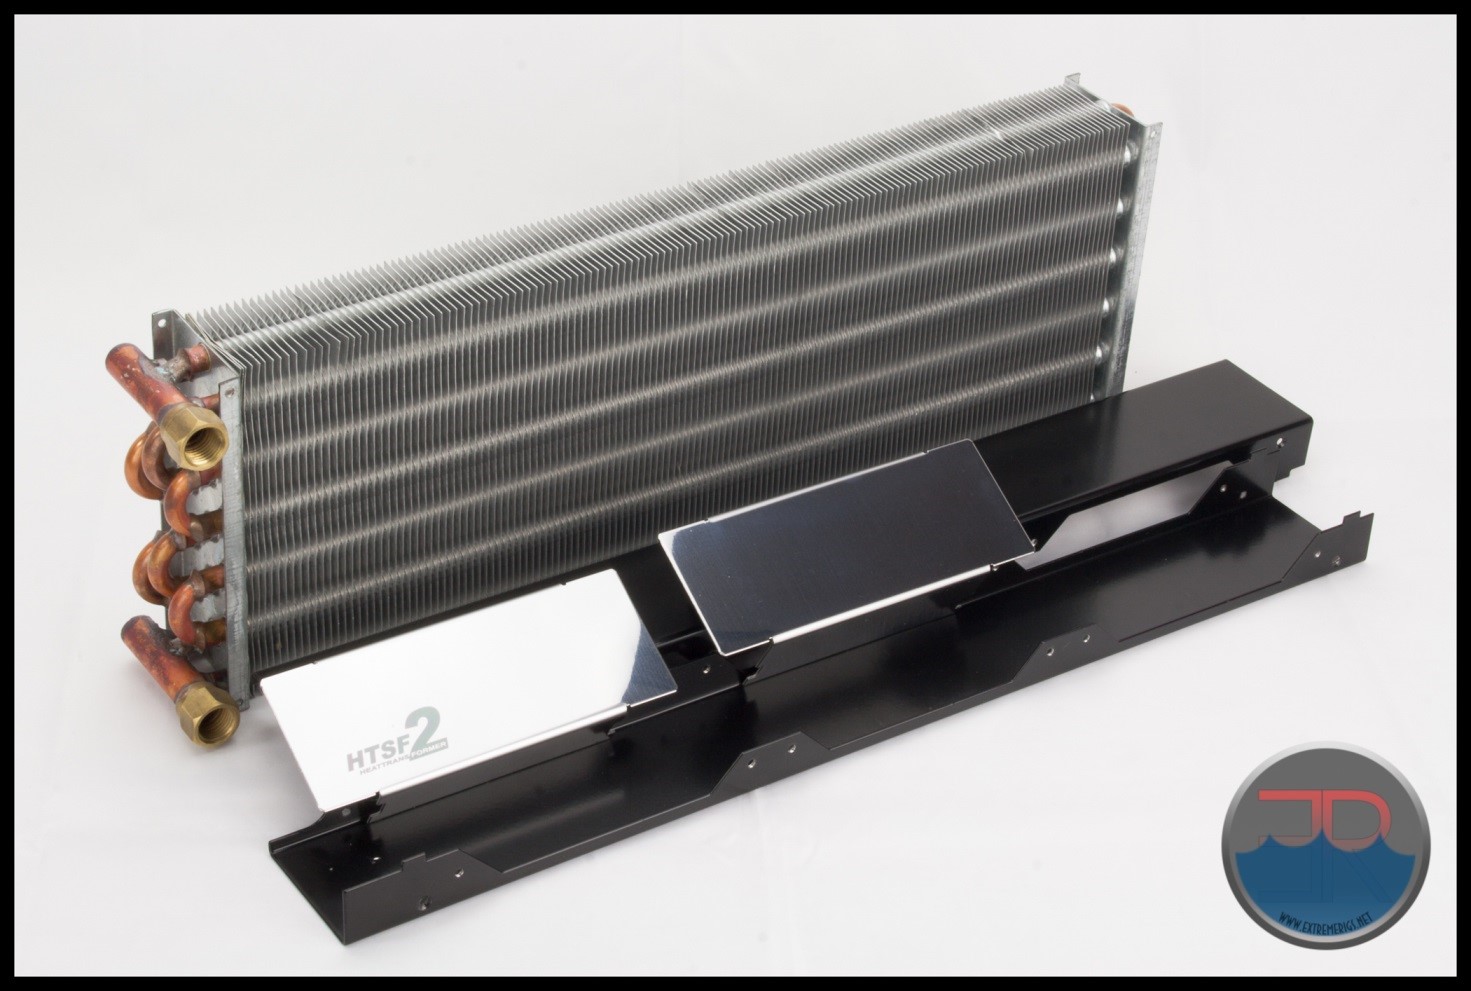
The HTSF2 is shipped a rather plain white box with some stickers.


It is not uncommon for Watercool to utilize the same packaging for various products. The 360mm appears to have been sent in a 480mm rad box with some air pouches to stop the rad sliding around. The box was a bit dented up at both ends but the radiator was in perfect shape.
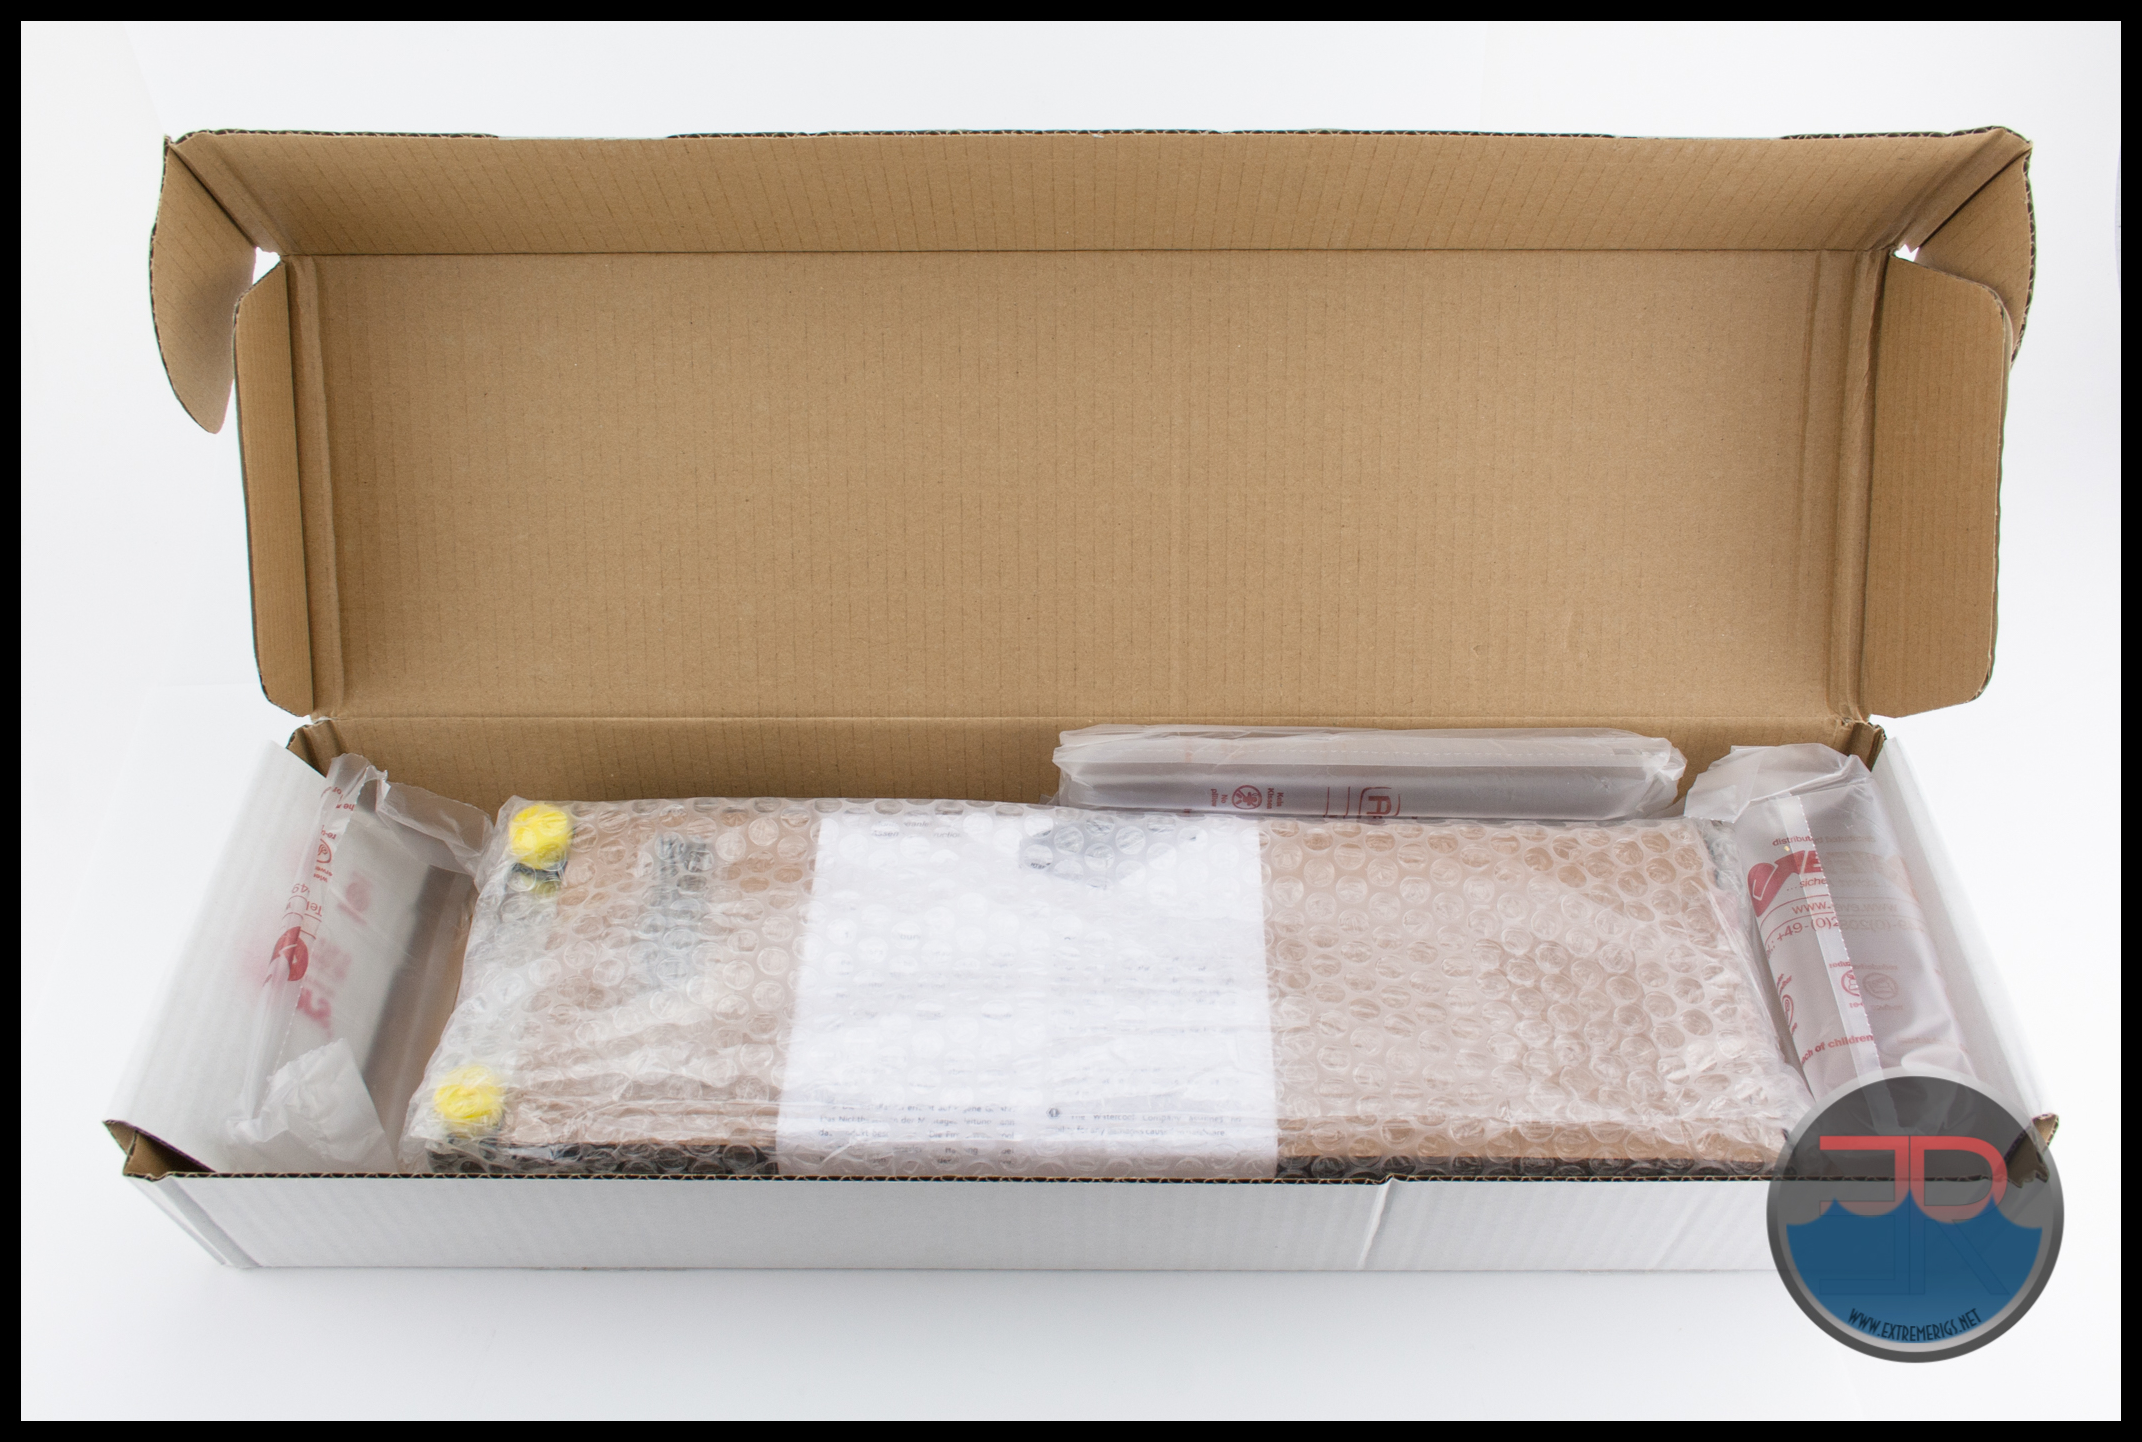
The radiator and accessories were wrapped together in bubble wrap.

A half decent effort has been made to protect the core by placing a protective cardboard sheet across the port side to which the attachment screws have been taped. I say half decent because the other side does not have the cardboard protection.

We also get a product sheet with a brief description, technical data and installation instructions.
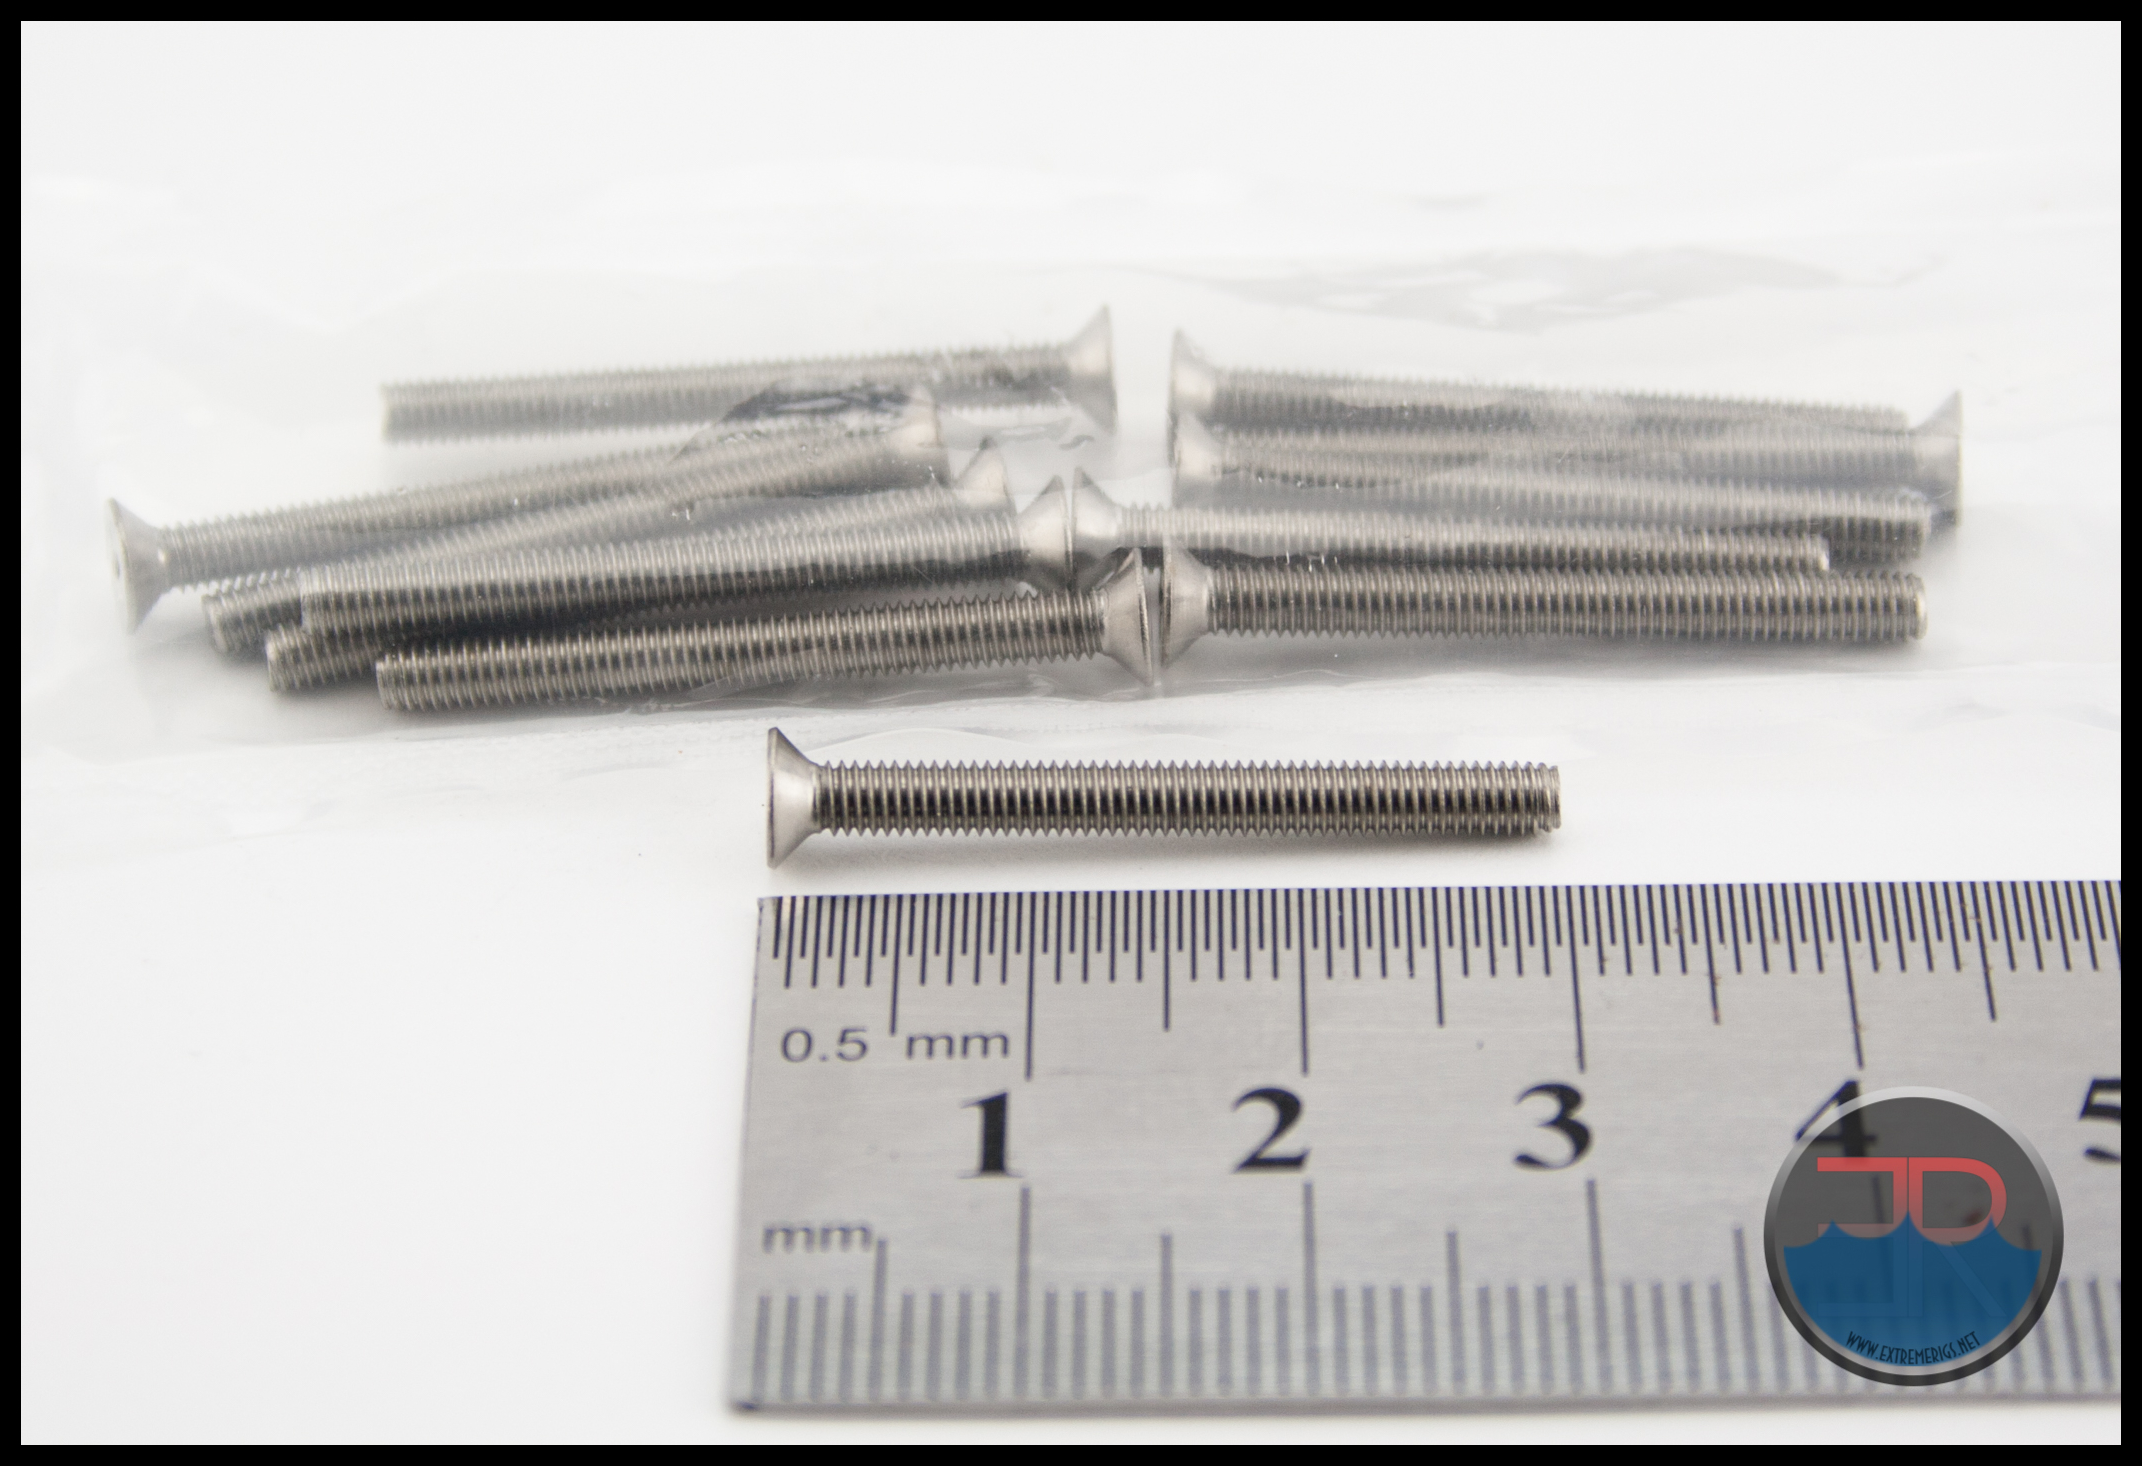
I thought the use of countersunk heads on the provided M3 screws was unusual, but found them to work perfectly with the hard plastic frame of the AP-15 fans used for testing. Care might need to be taken on fans with rubberized corners. These screws would be unsuitable for use with filters or guards fitted in front of the fans.
Extent of Delivery:
1x Radiator
1x Installation Manual
12x M3 Countersunk 30mm Total Length Philips Head Screws
Onwards to technical specifications!
Technical Specifications
Technical specifications as listed by Watercool:
- Material heat exchanger: Copper (tubes), aluminium (fins)
- Material corpus: powder-coated Steel (black), Stainless steel
- Dimensions (L x W x H): 410 x 130 x 50 mm
- Weight: approx. 1550 g
- Pressure tested: 5 bar
- Threads: 2x G 1/4” (DIN ISO 228-1)
Dimensions Measured on the radiator tested (retail unit):
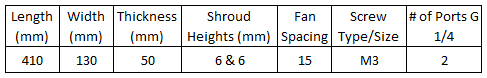
Radiator Core Dimensions:
At 50mm thick The HTSF2 classifies as a medium thick (35mm – 52mm) rad in the round-up.
The fluid volume was unable to be measured due the to flow path of the tubes.
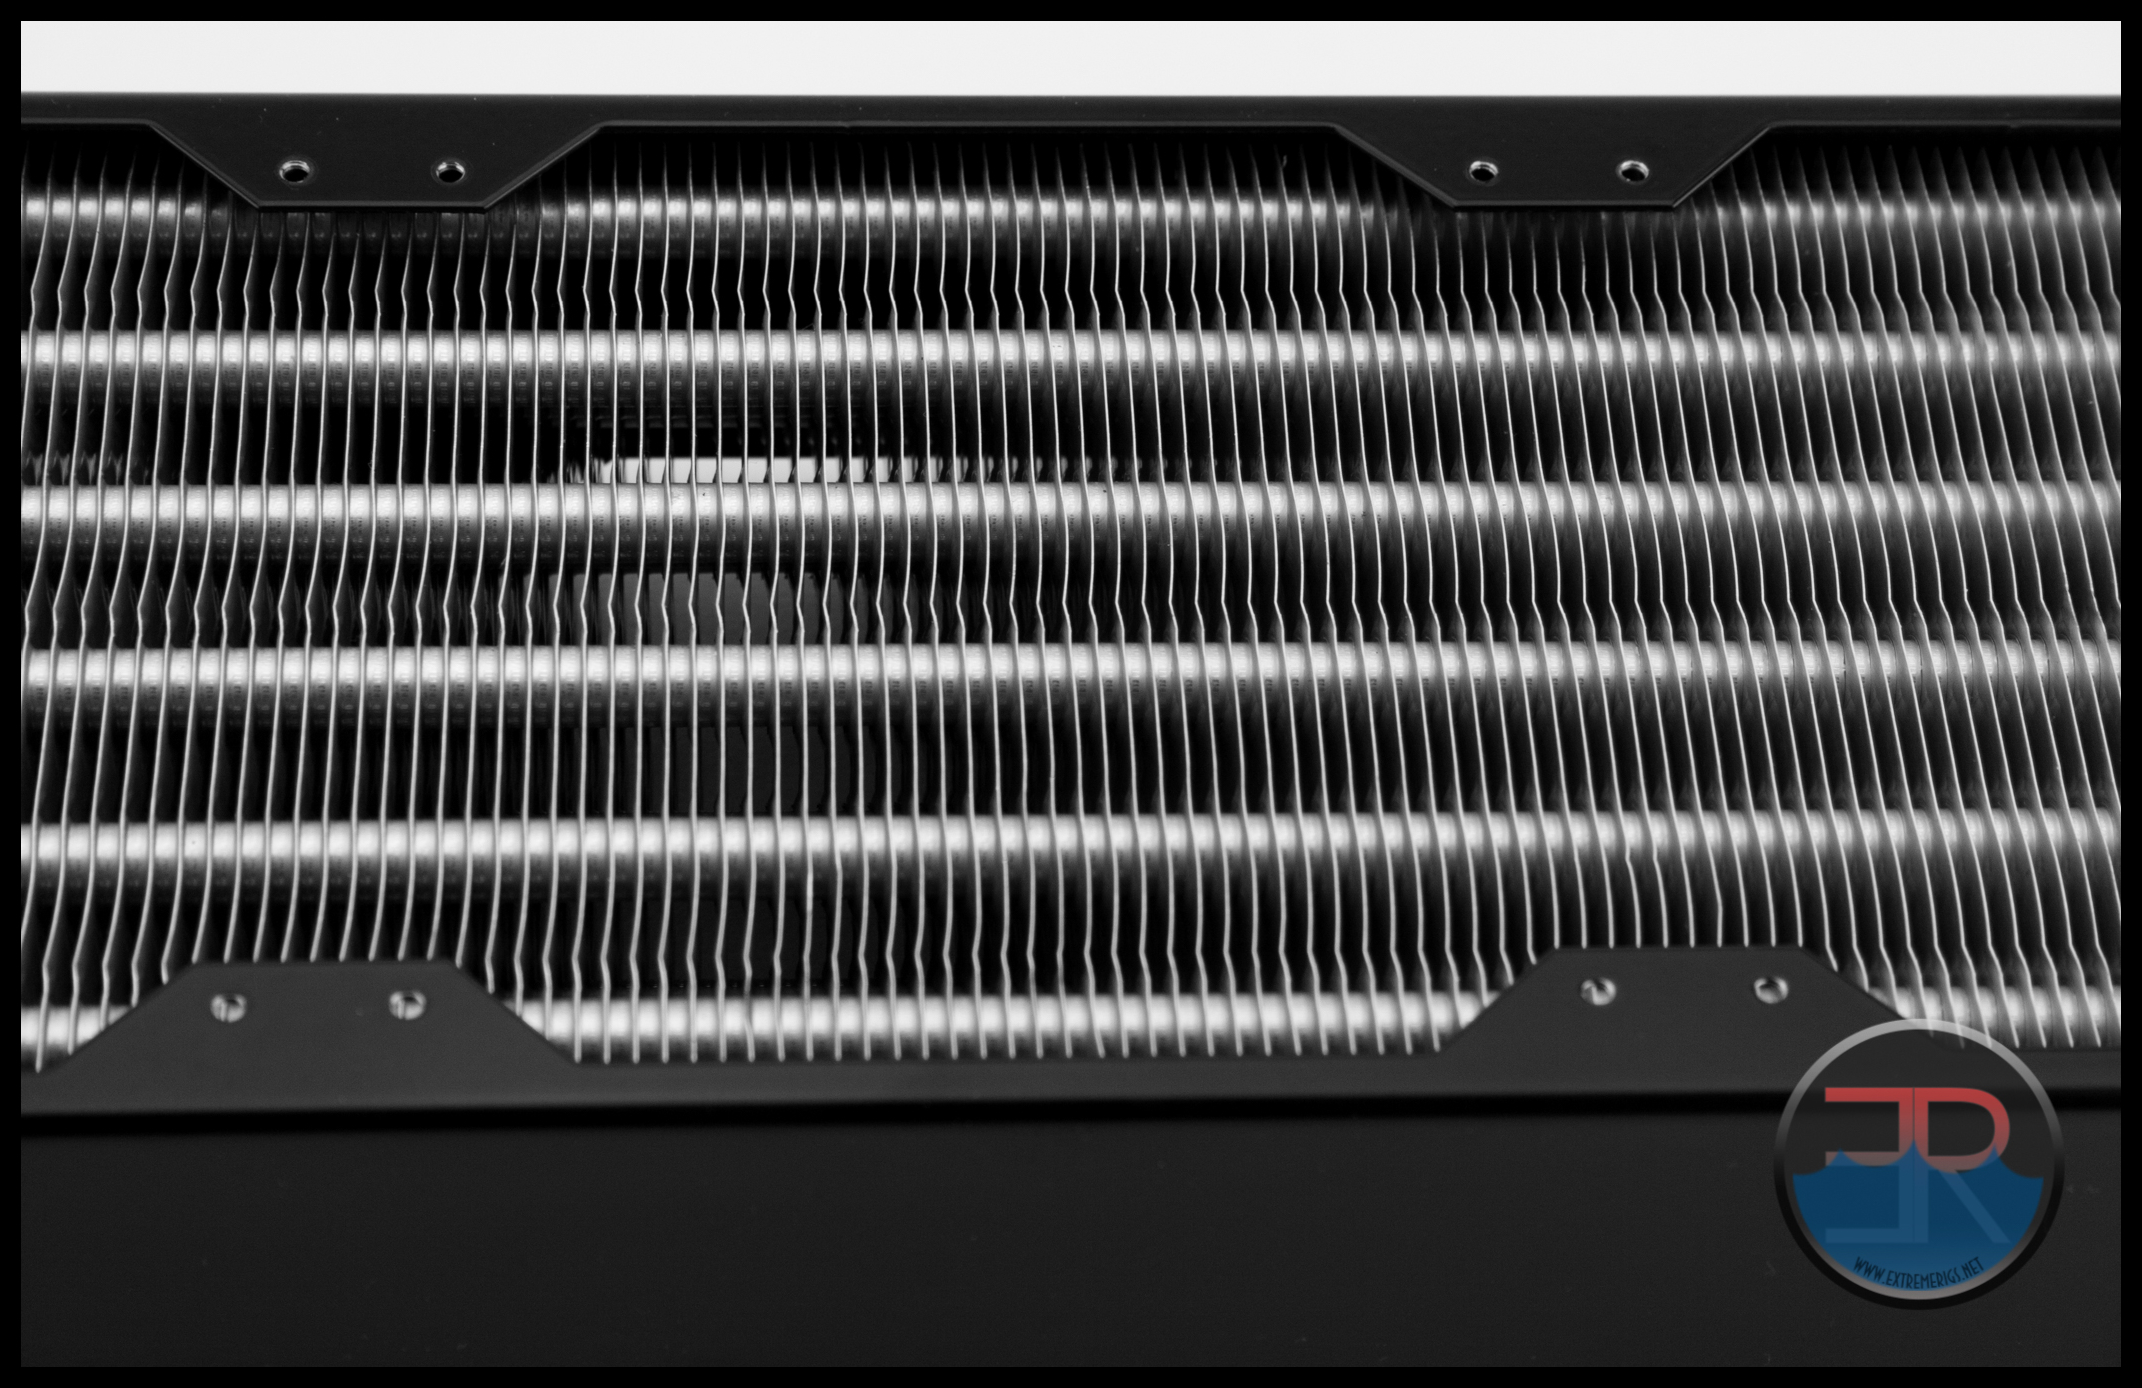
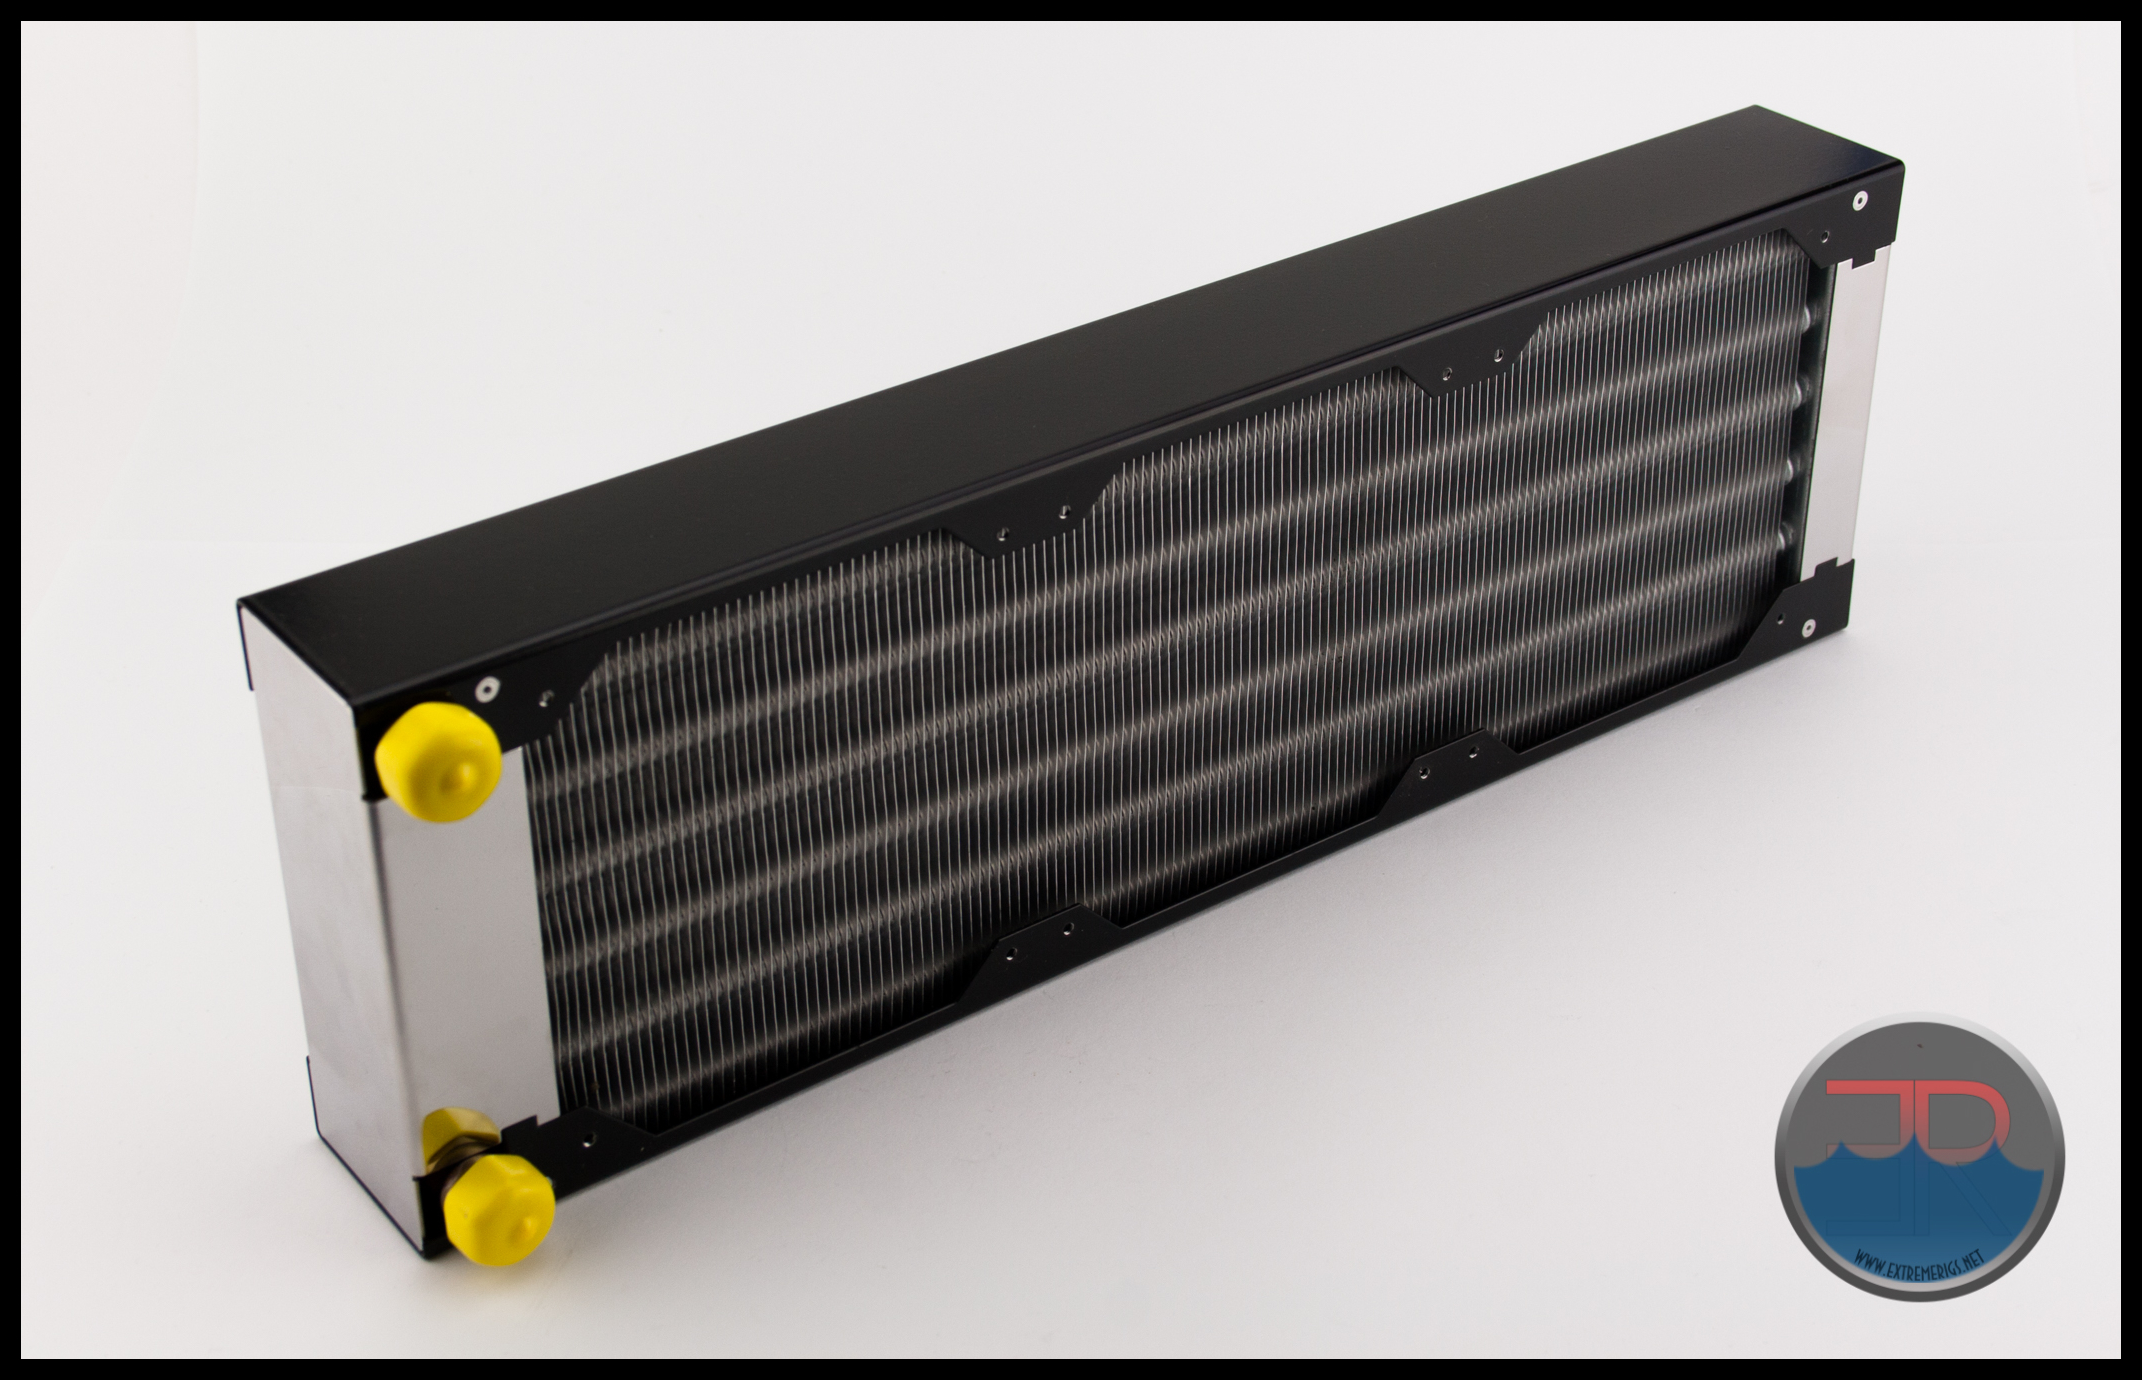
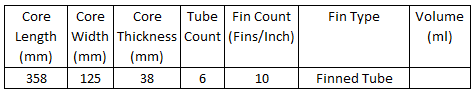
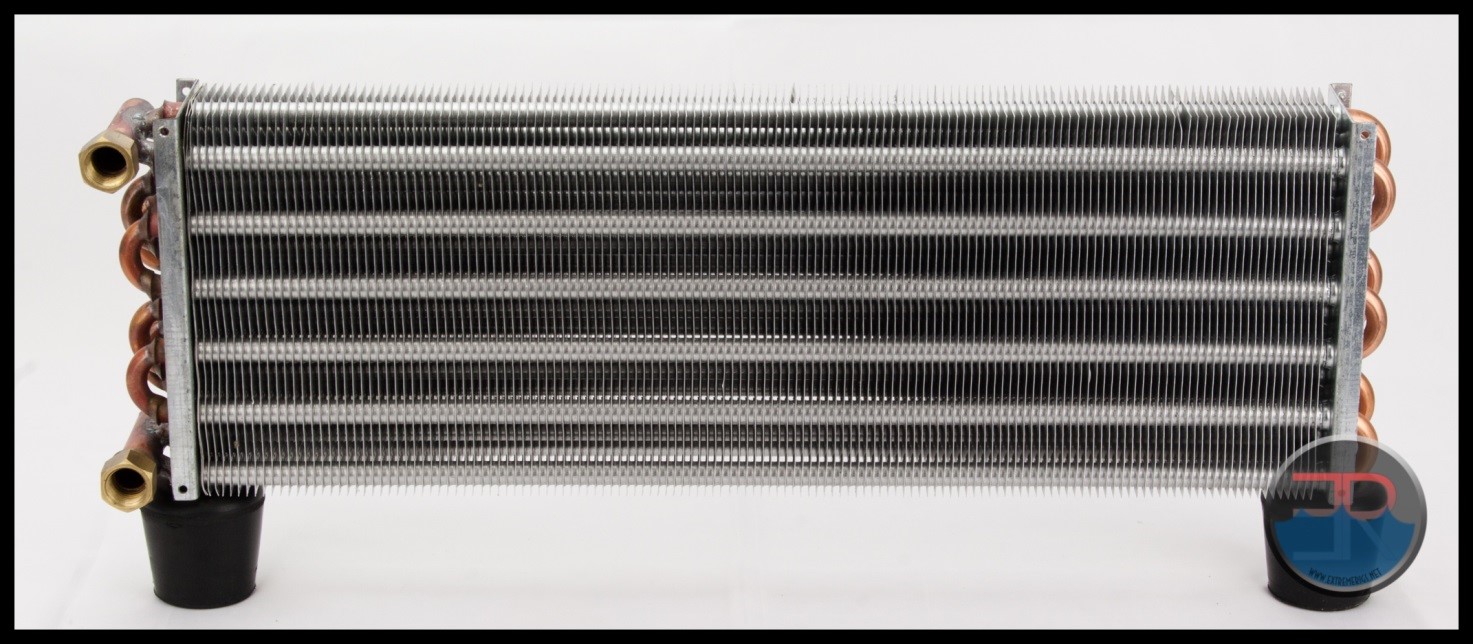
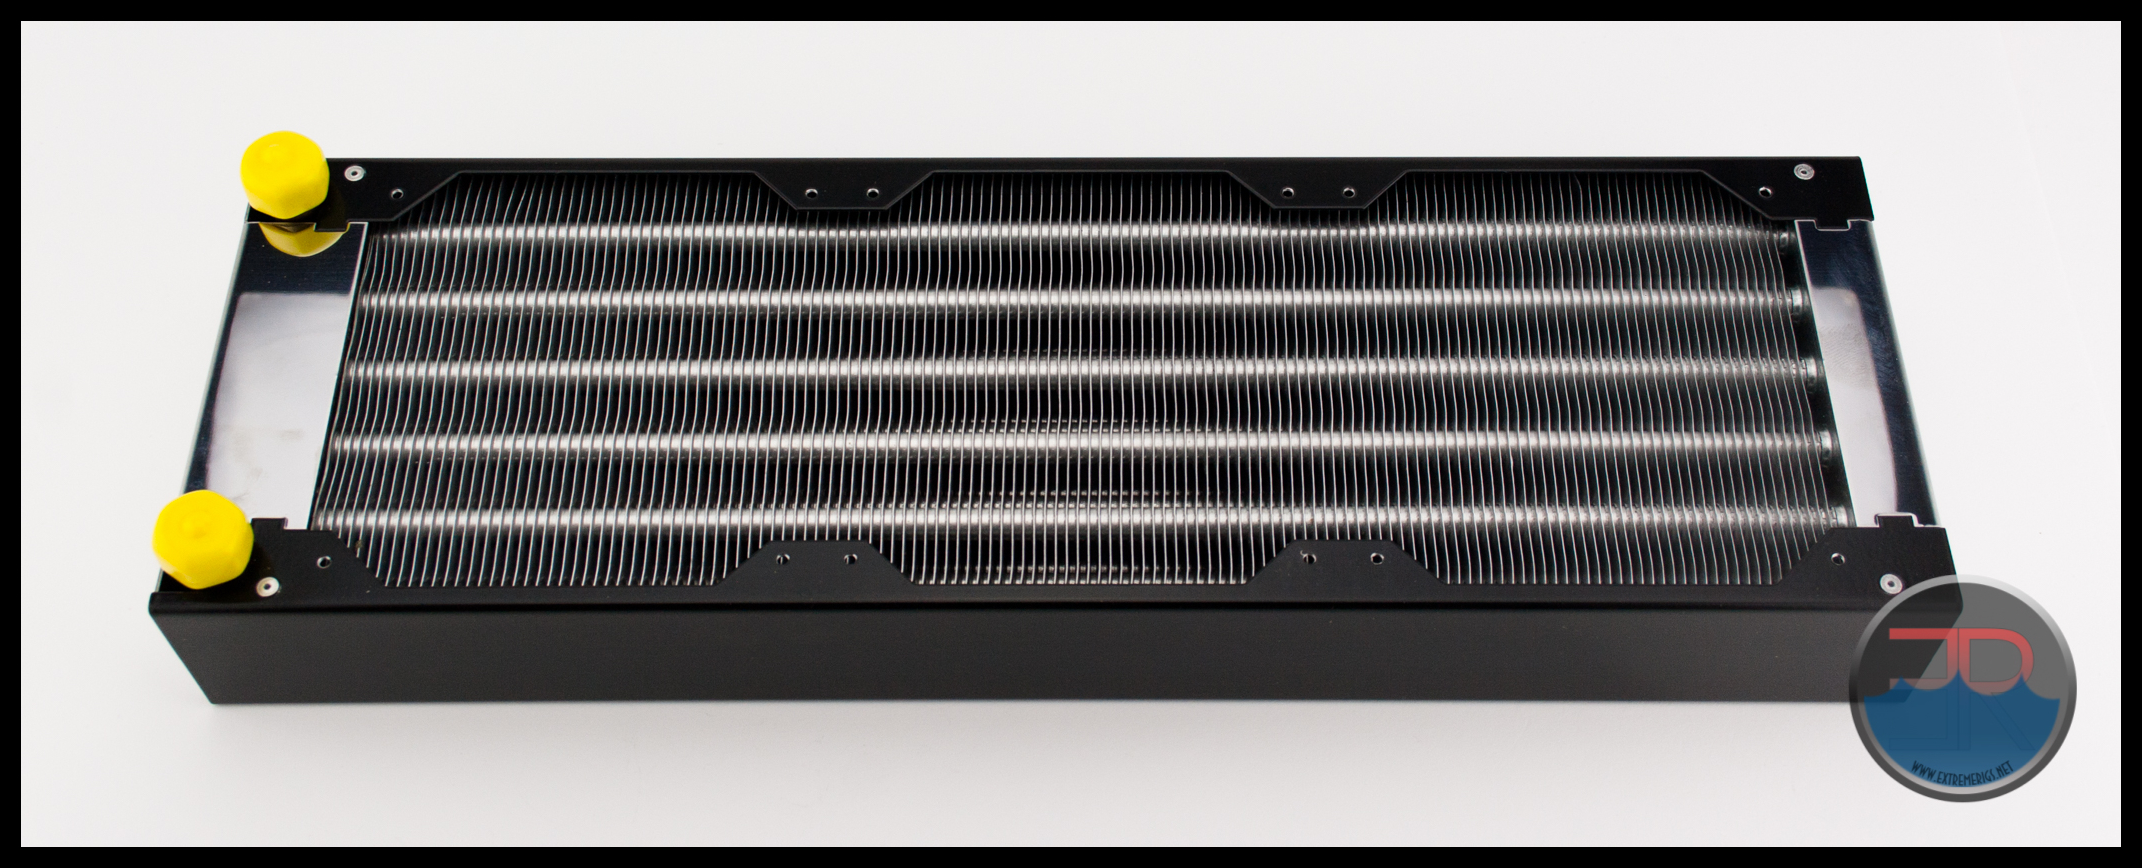
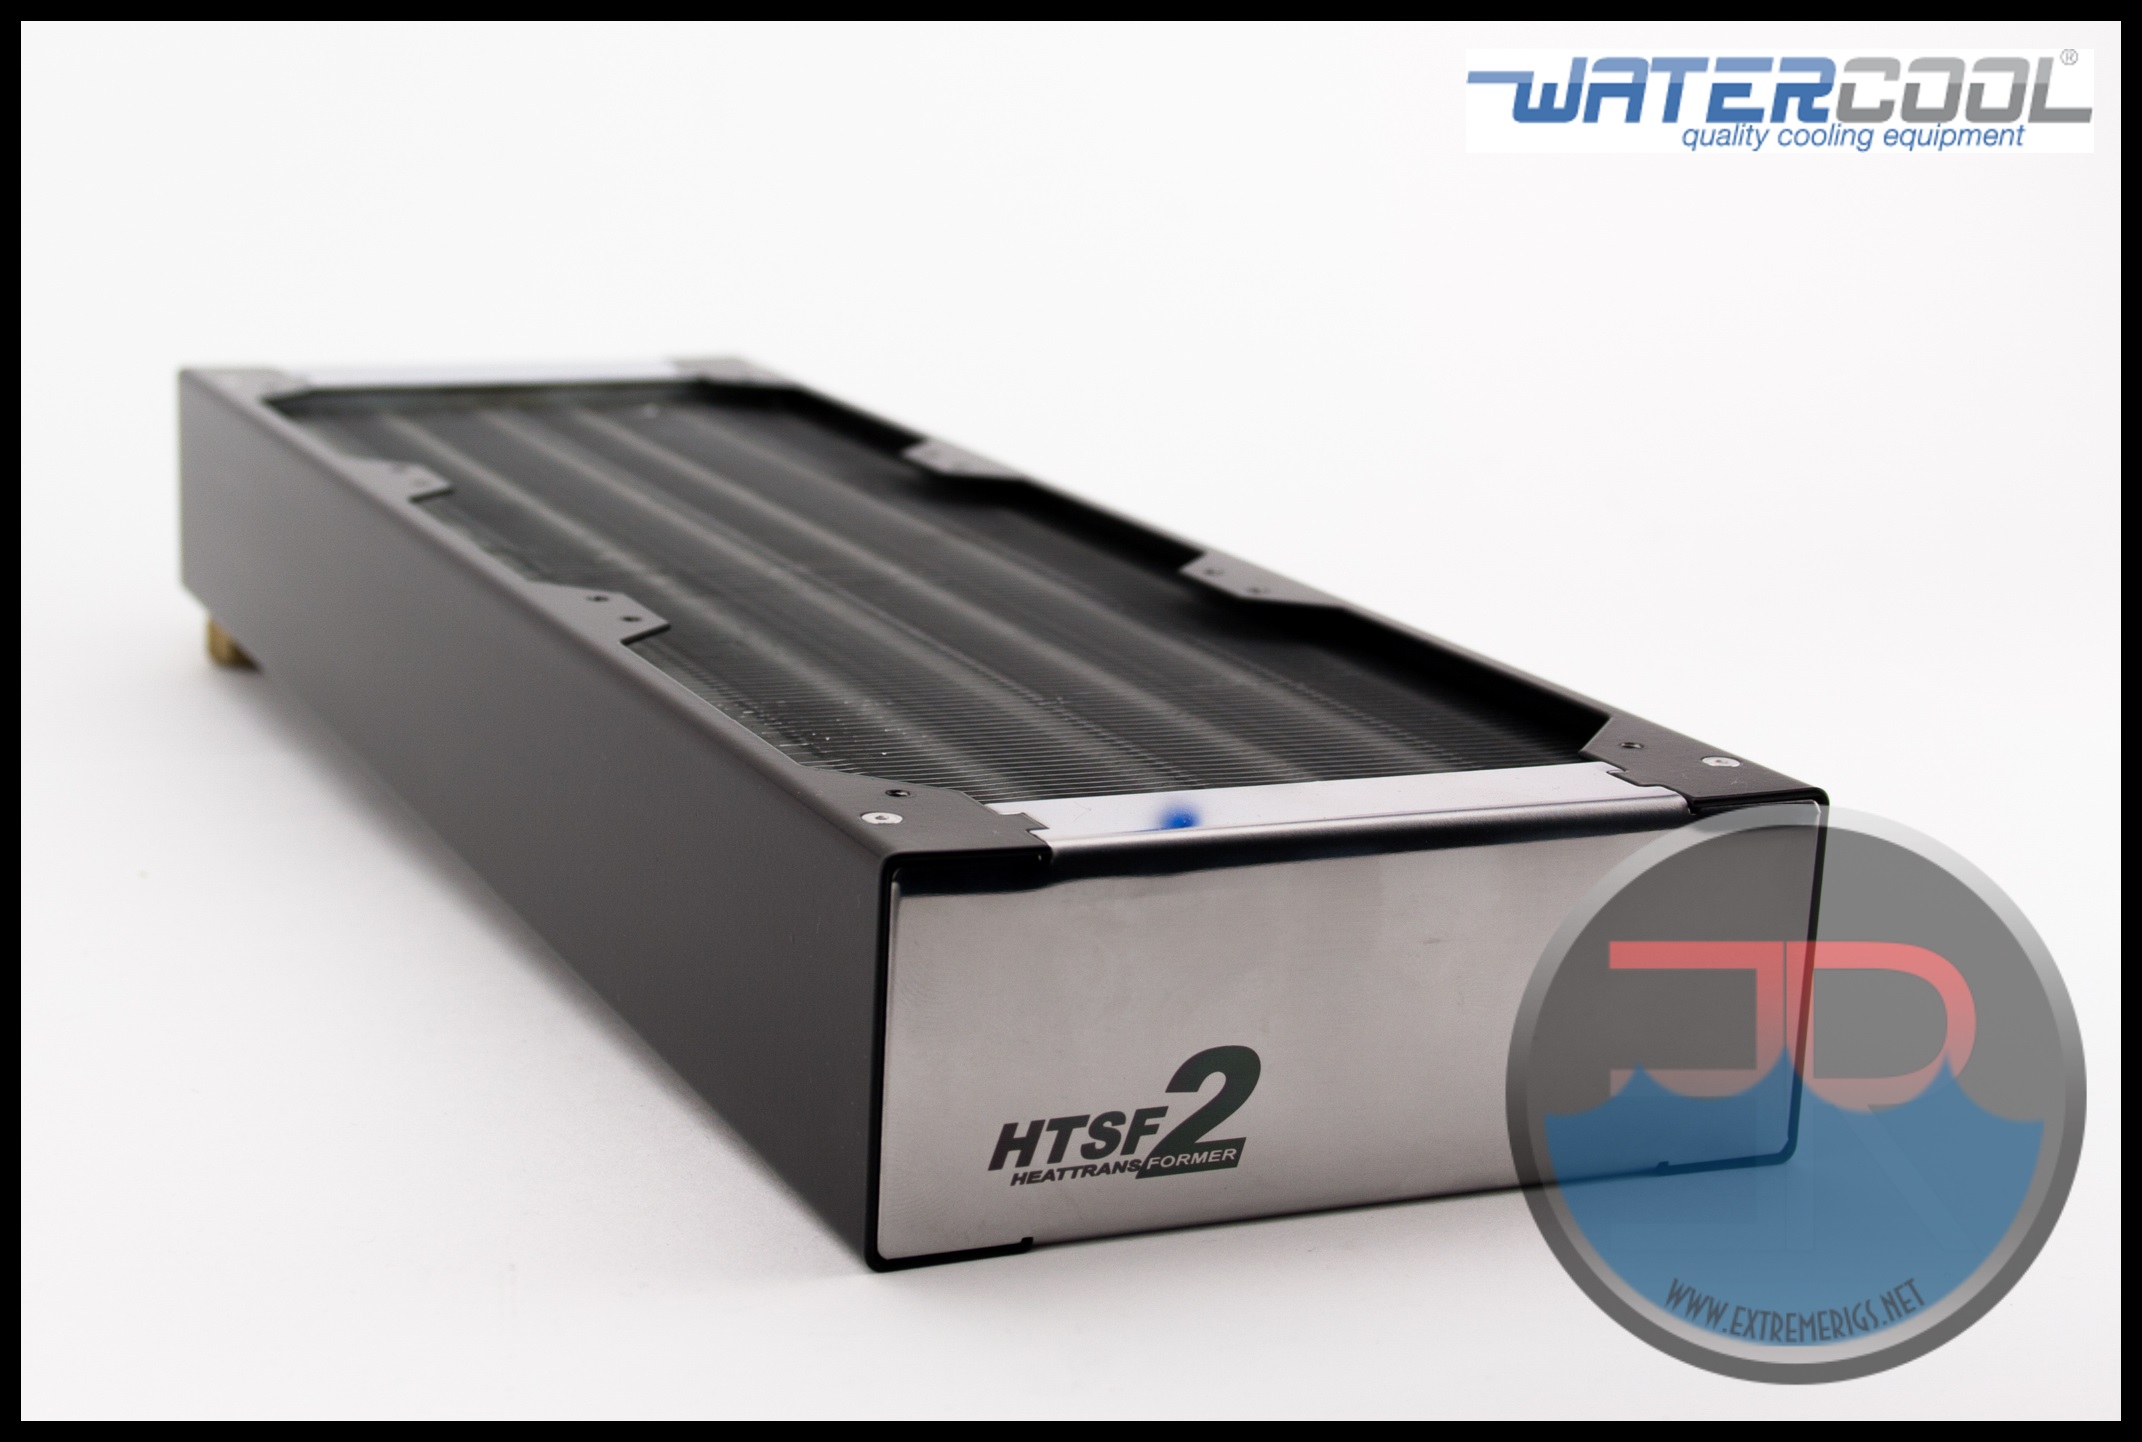
It has low density core of just 10 FPI. The fins are aluminium but the tubes are copper which have been painted silver to match the fins.
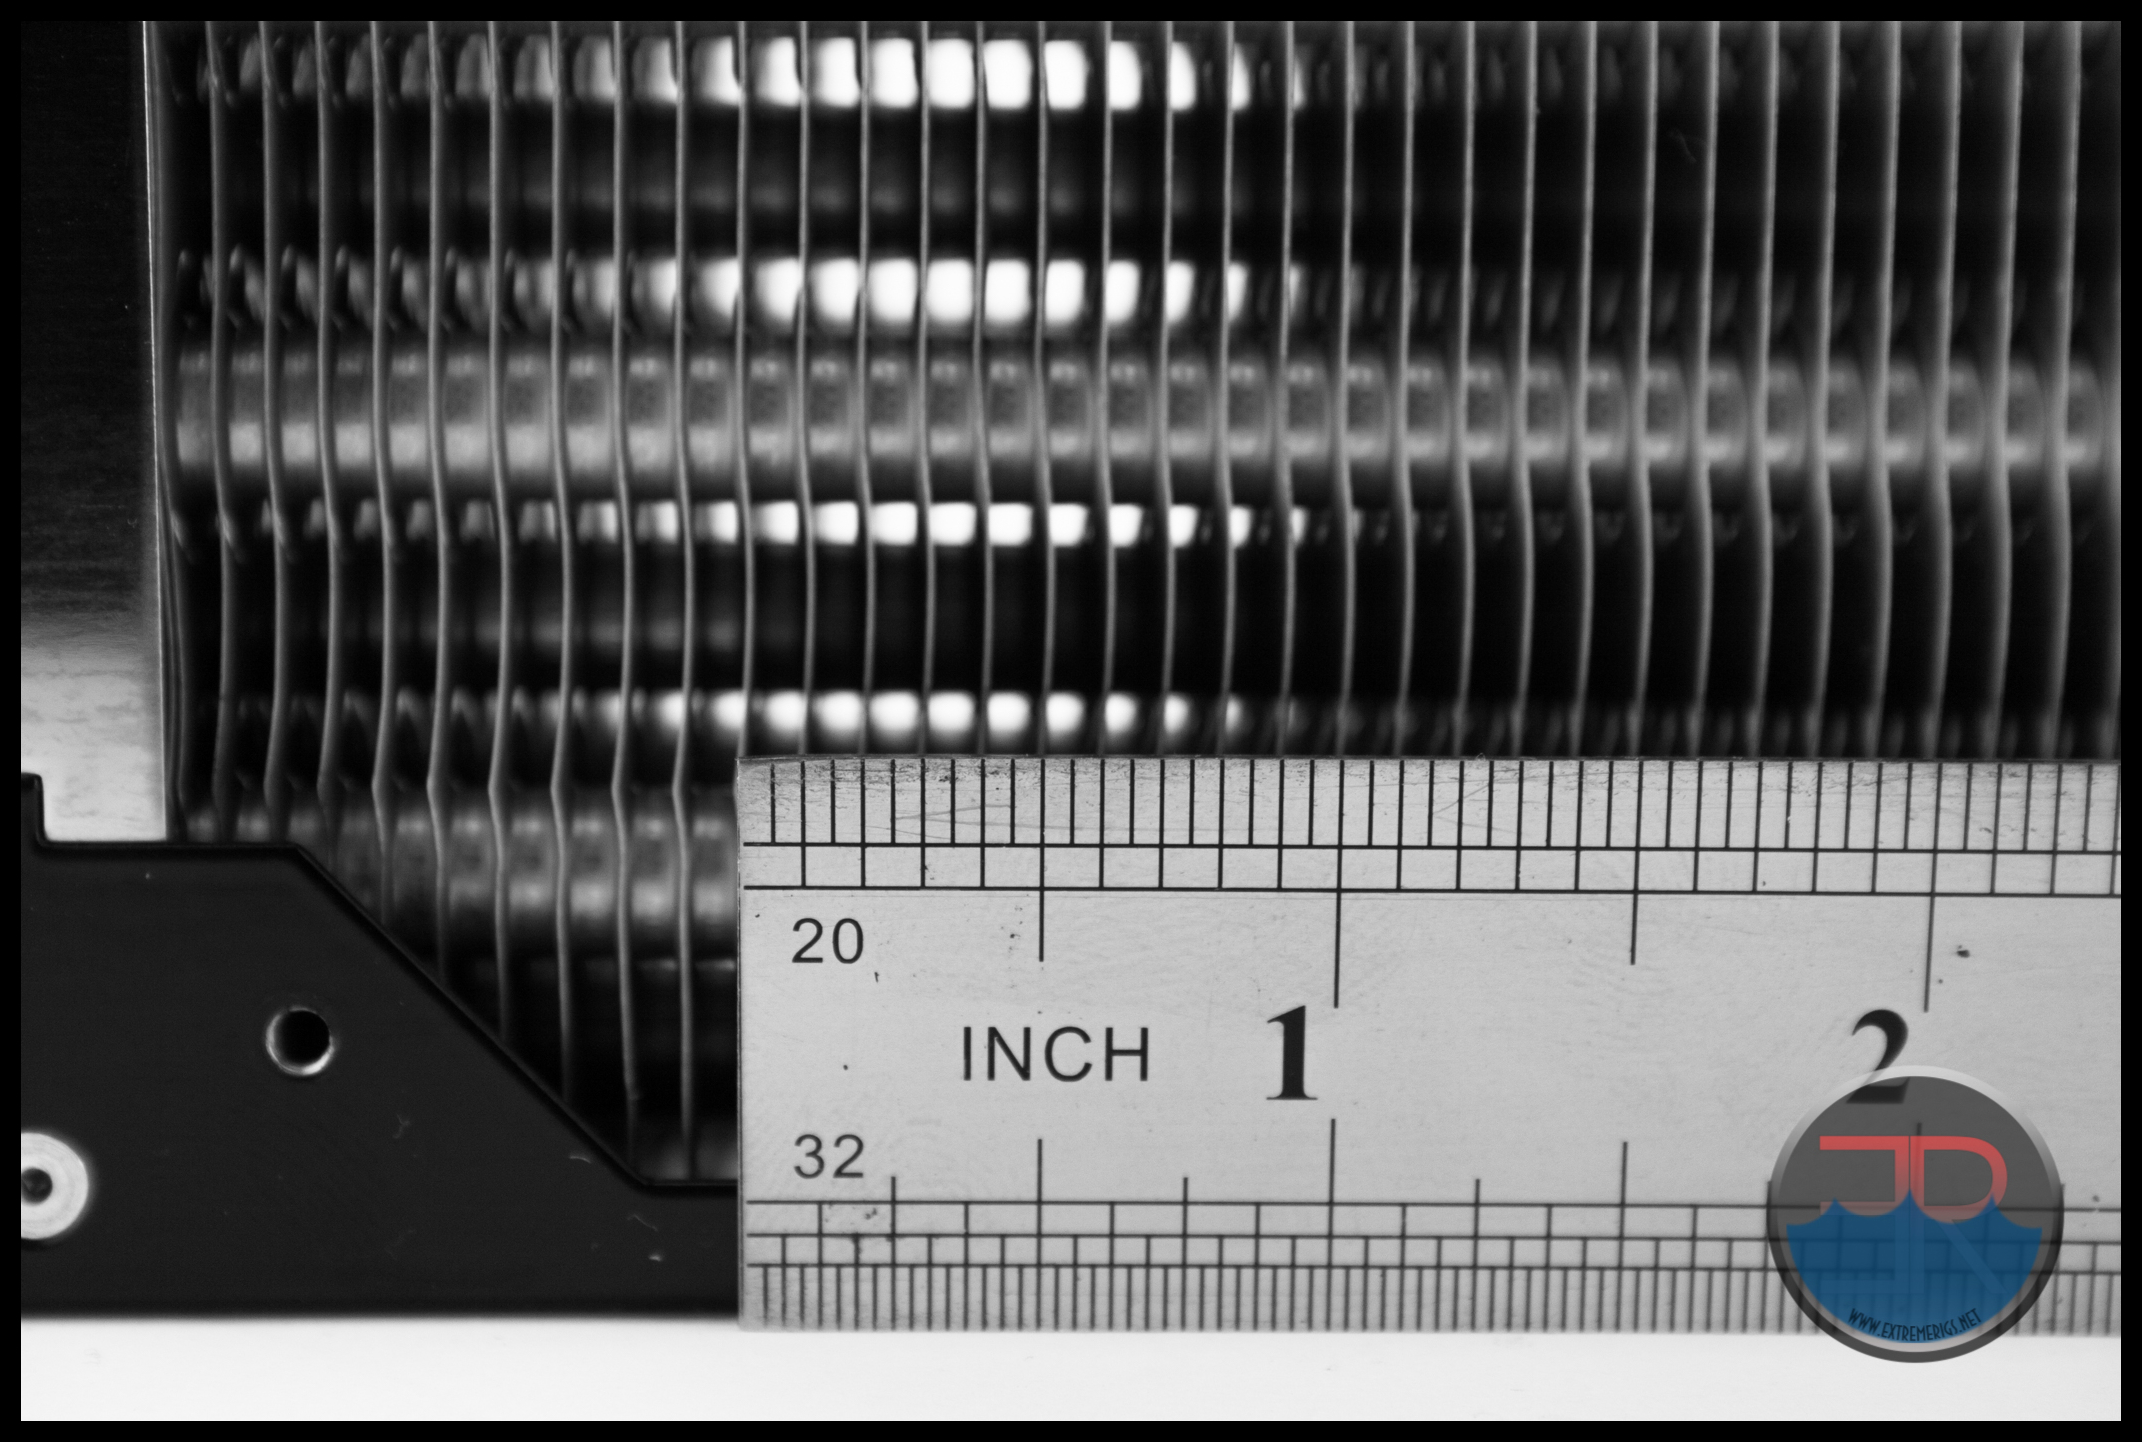
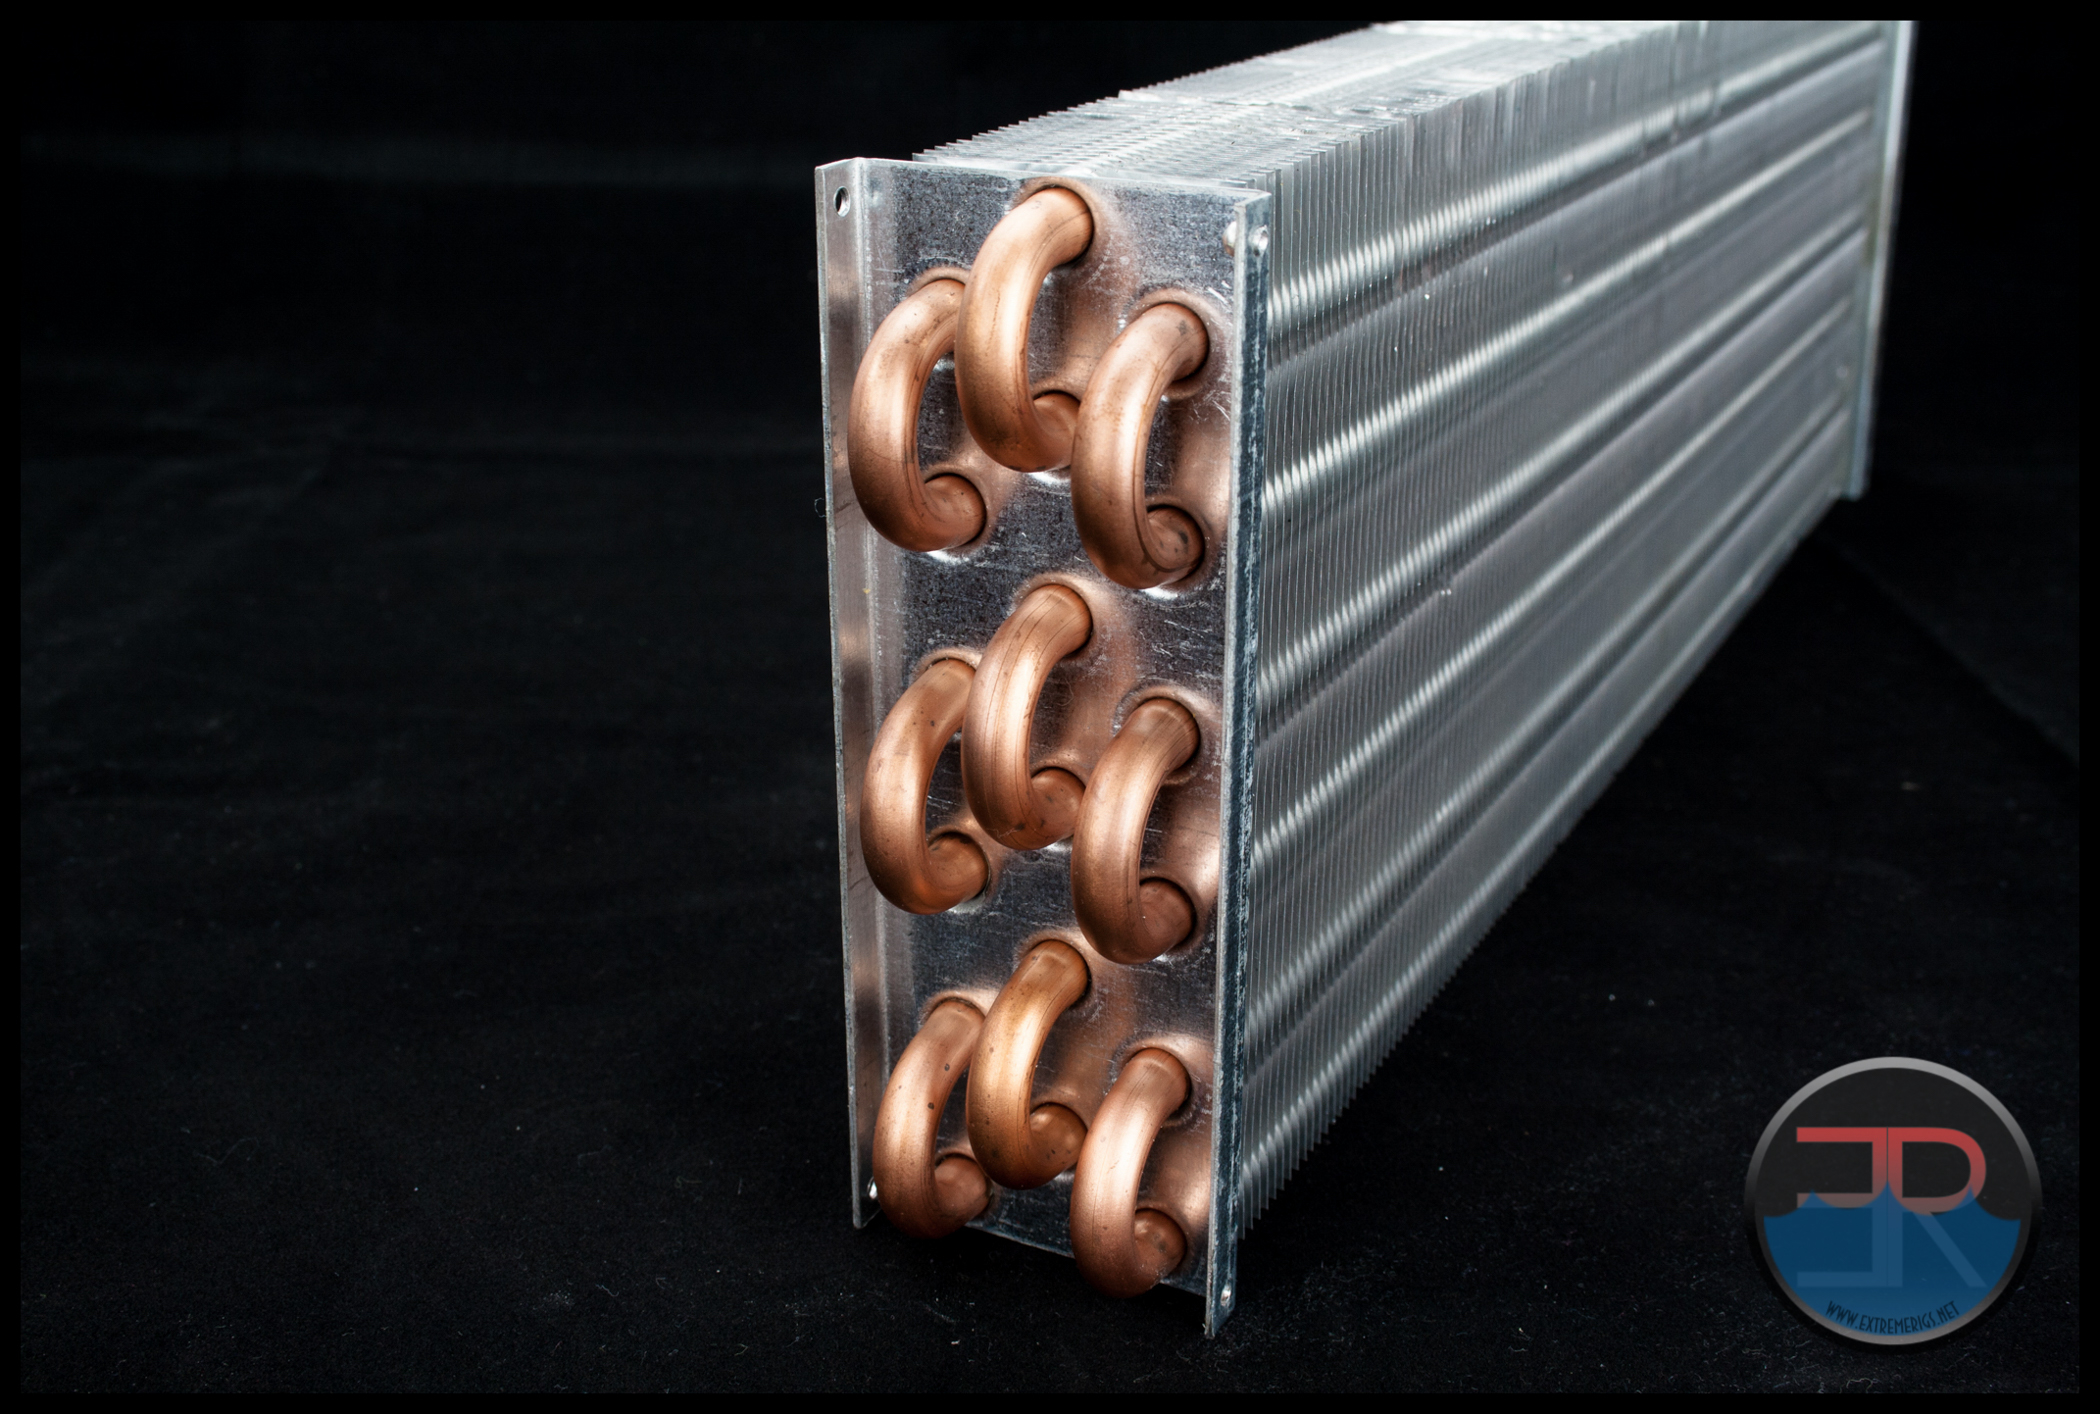
The HTSF2 is the only finned tube style core in group 1 of the round up. The core consists of 3 parallel tubes that run back and forth across the radiator six times. In case that wasn’t clear I decided to dismantle the HTSF2. The ability to dismantle makes the HTSF2 a modder friendly rad, by being able to remove the panels for painting if black is not your thing.
In my tube count I listed 6 – which is the tube count across the face of the core. But the finned tube style core is so much different that it requires further explanation. The tube configuration is actually made up of 3 rows of 3 U shaped copper tubes, effectively creating 18 tubes. These are then soldered together on the port end to create 3 total tubes that join at the ports. These pictures might help to imagine this:
The non port end is not soldered because these are pieces of copper tube that have been bent on this side. The port end on the other hand gets the soldered joints:
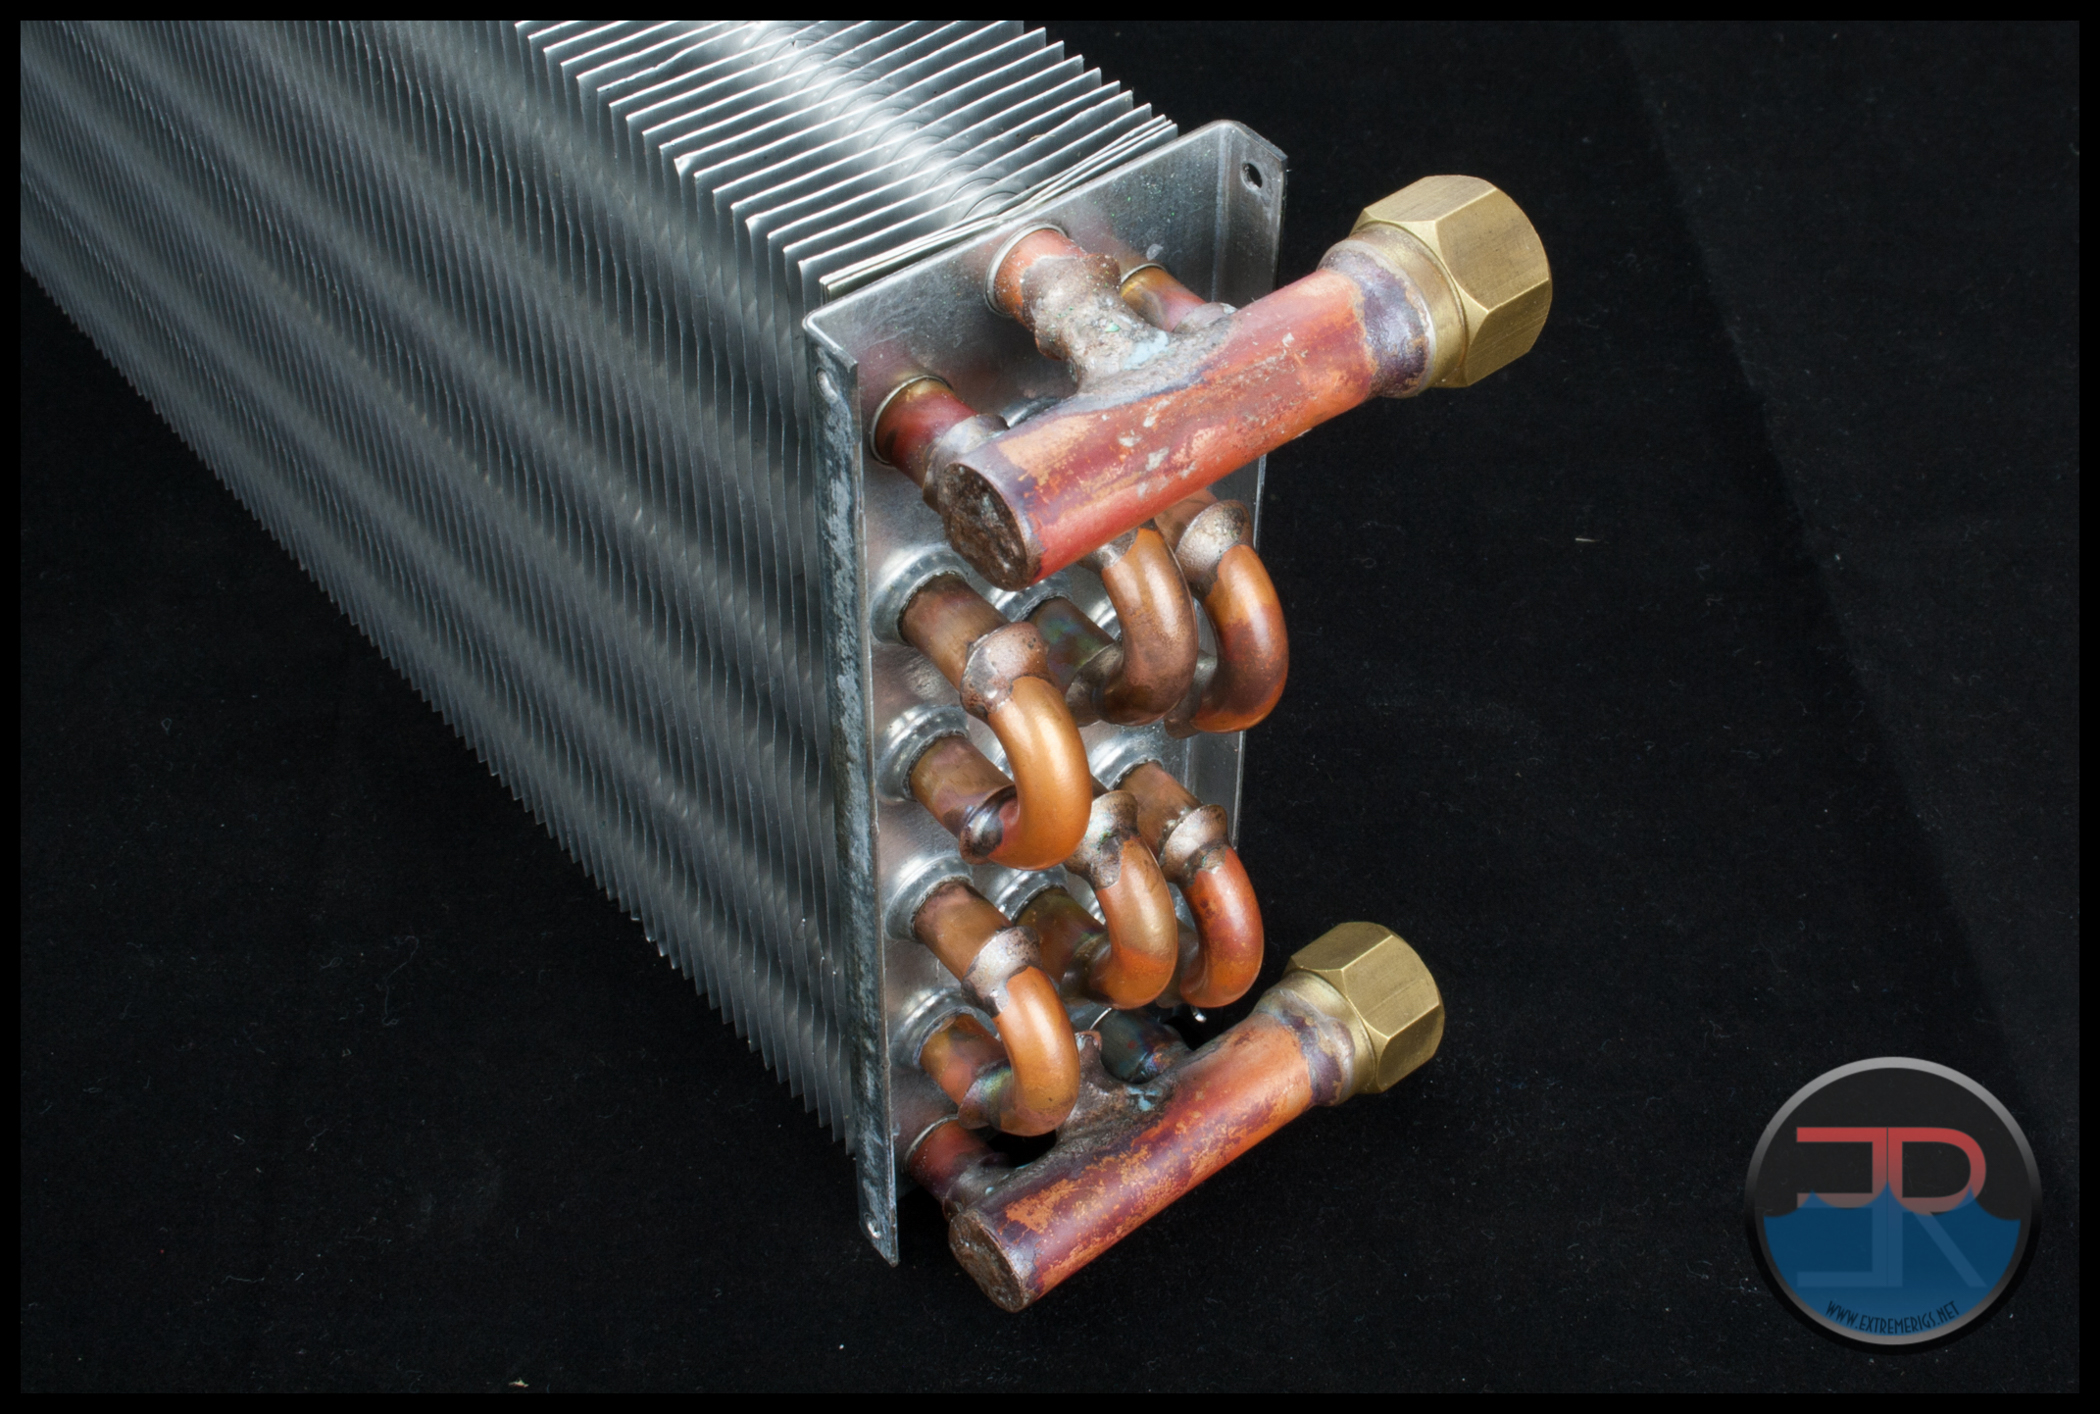 Now you can start to piece together how it works. Each of the G ¼ ports has a small “splitter” tube right behind it. So when coolant enters the rad it is immediately split into thirds for it’s journey through the core. As the coolant is traveling through the 3 different flow paths simultaneously, it is known as parallel flow.
So if we again look at the face of the rad we can follow the front “tubes” flow path as it travels right and left six times (Hex Pass) until it exist the outlet port. Now picture the 2 other “tubes” behind it with coolant flowing in the same pattern simultaneously and we have the complete picture of the flow path. Technically we could call this a Parallel Triple Tube, Hex Pass Finned Tube Core, but that might confuse people.
With all those 90° bends, 15 in total, I’m expecting this to be quite a restrictive radiator even though those bends are in parallel. Watercool advise otherwise with this statement “The triple parallel layout of the HTSF2 ensures a low flow-resistance”. I found this hard to believe particularly given the reputation of the Mo-Ra radiators but my restriction testing will provide the answer.
Finish and Features
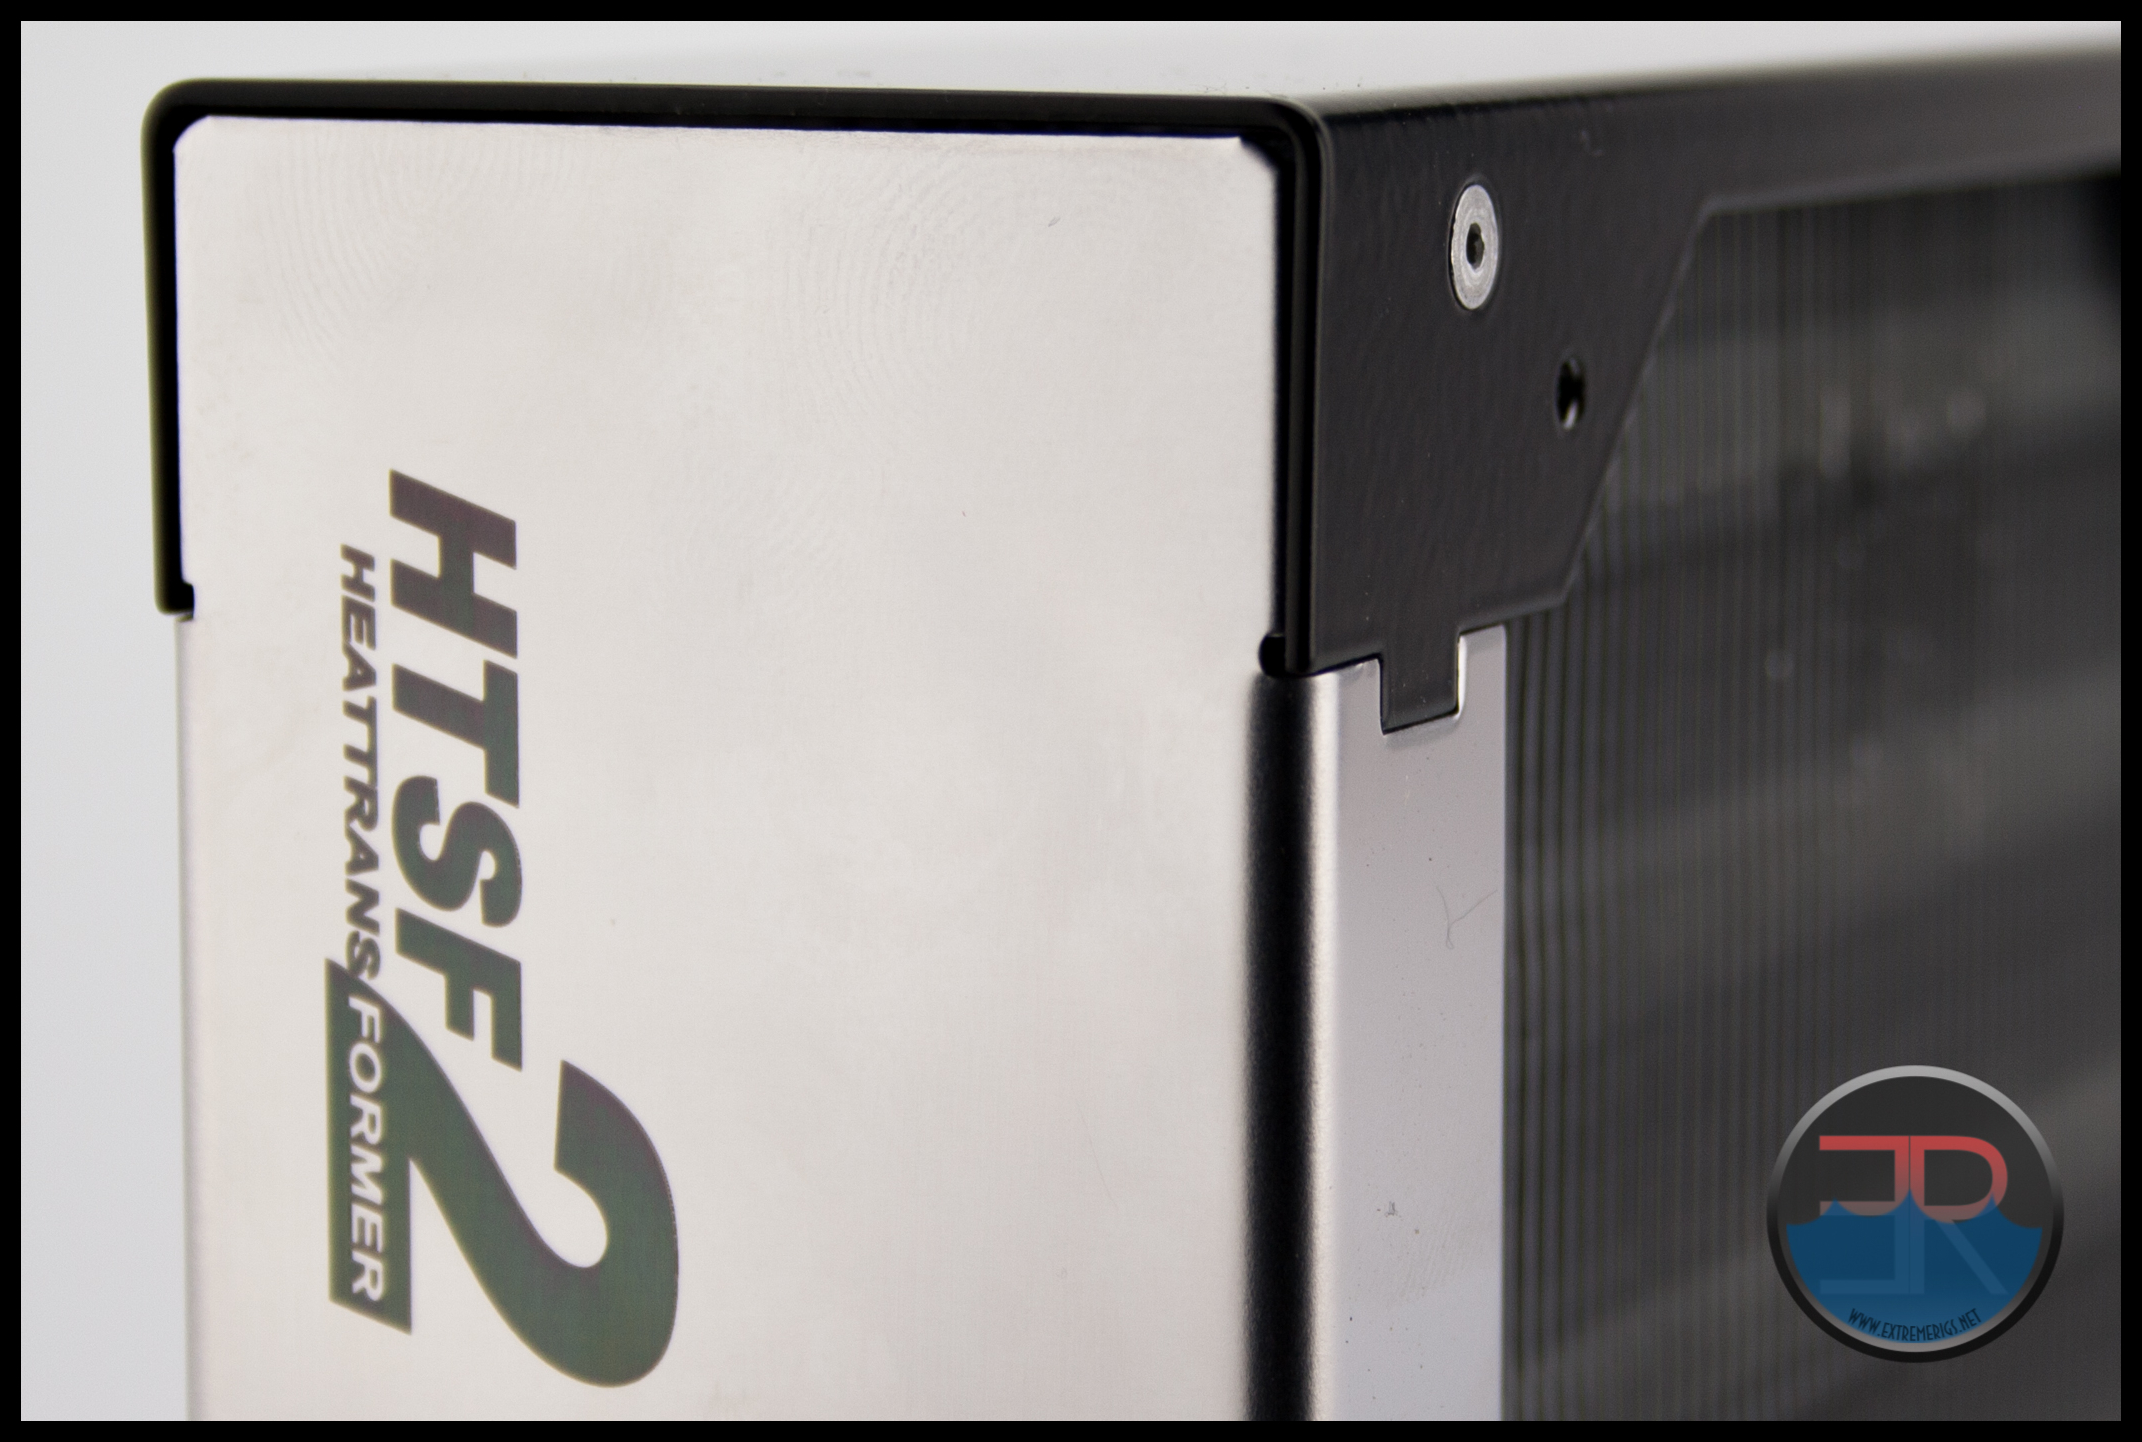
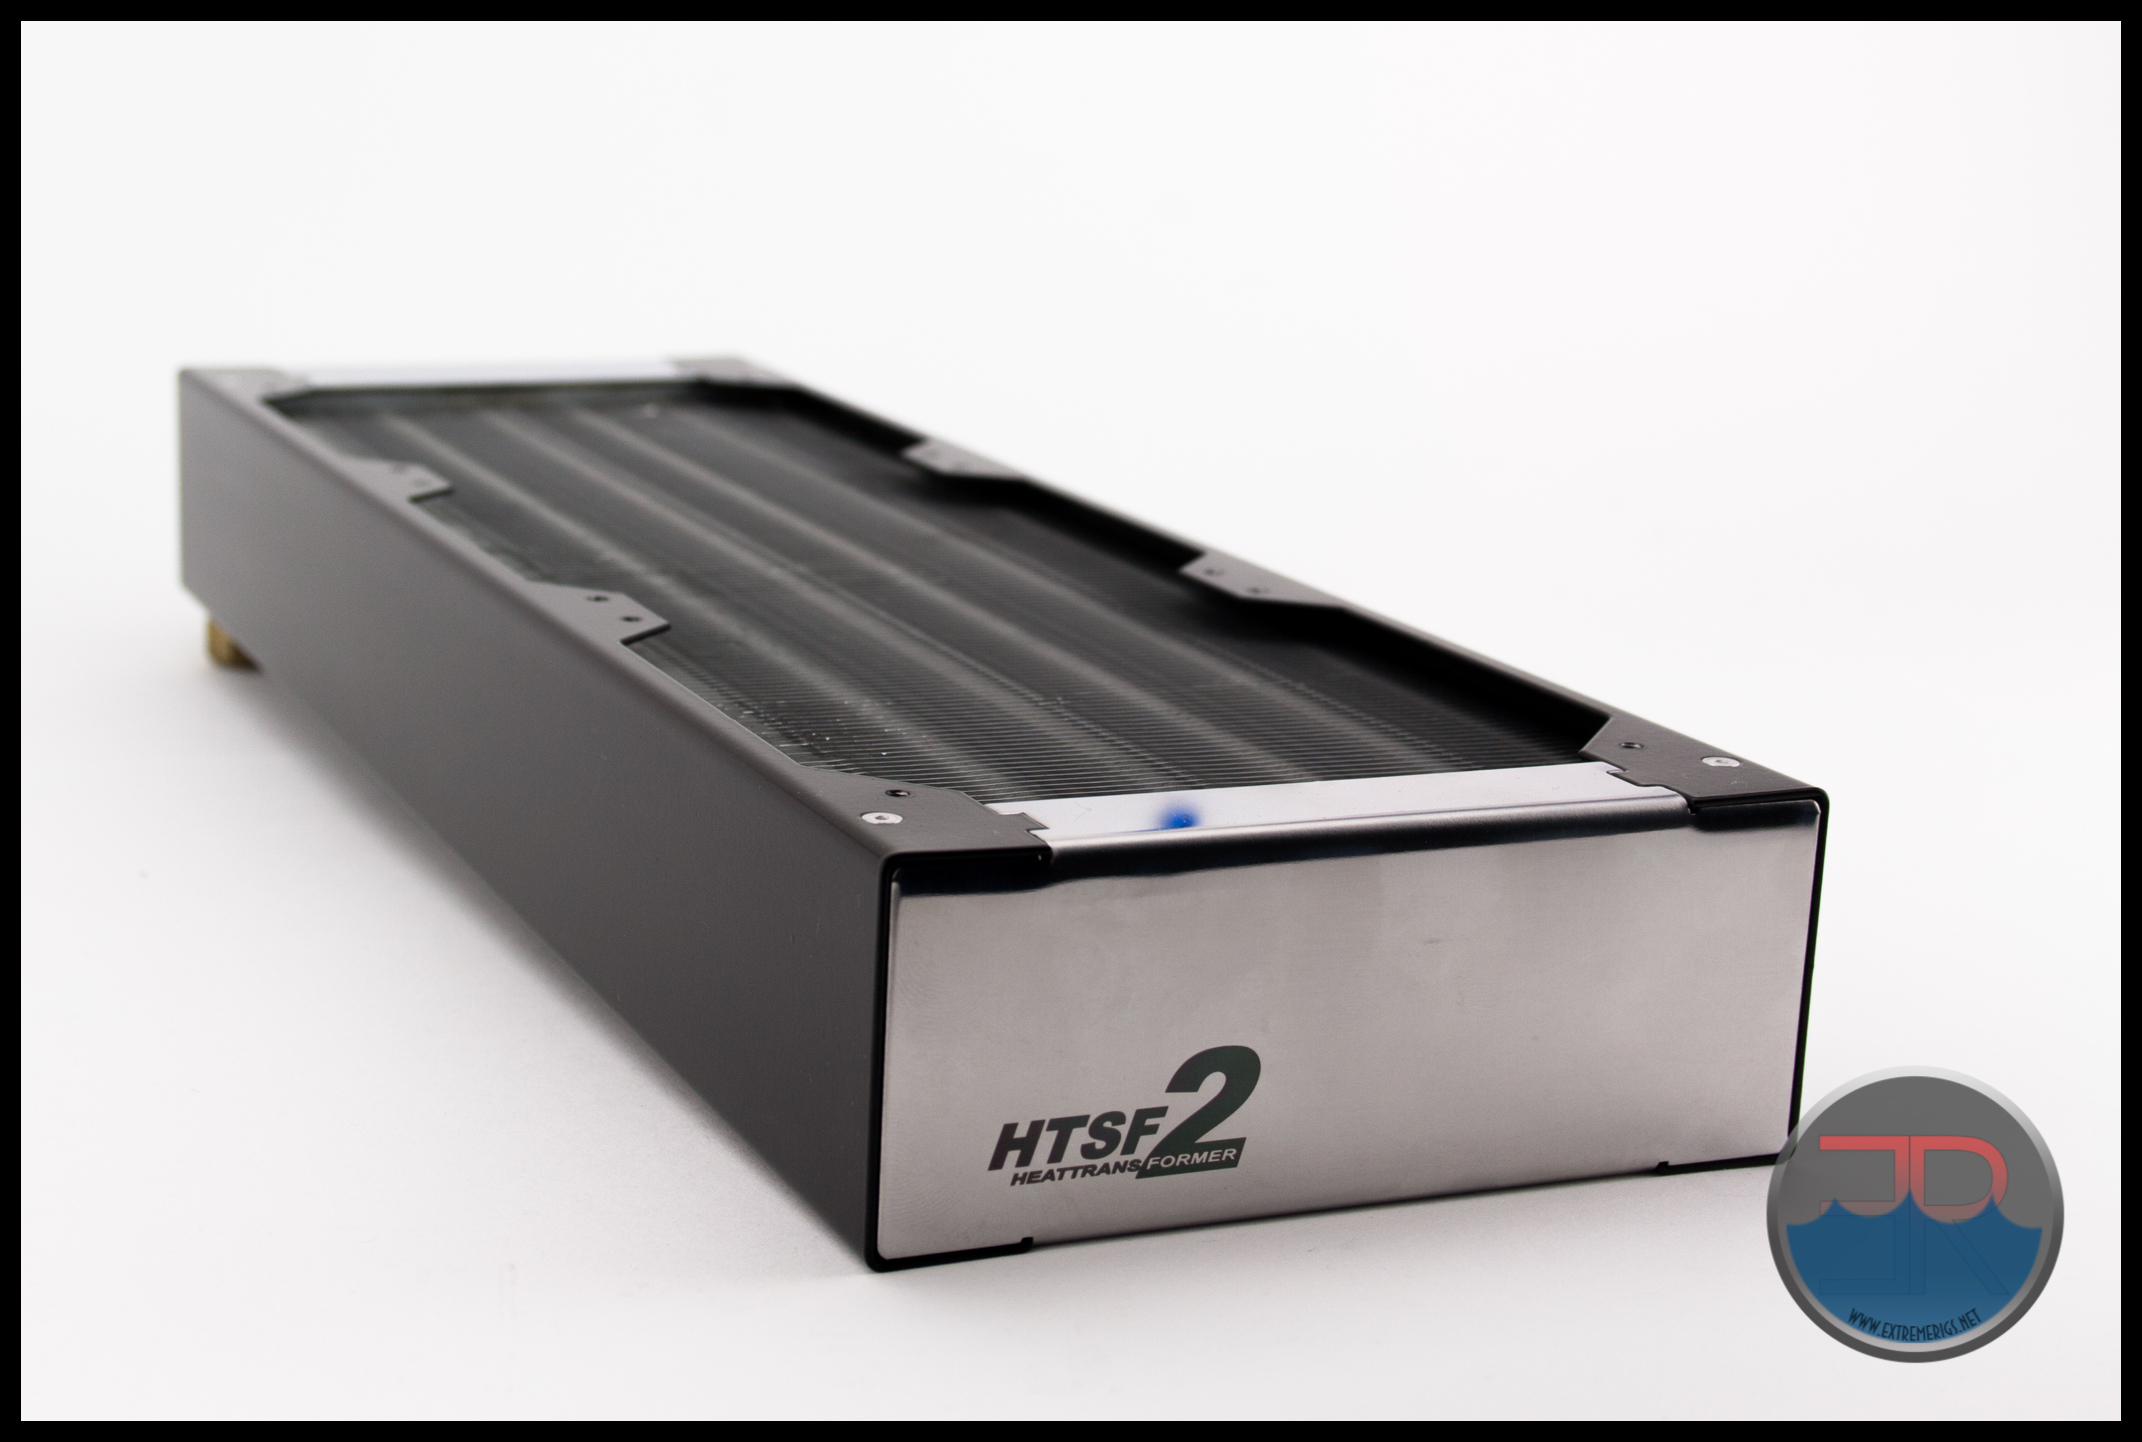
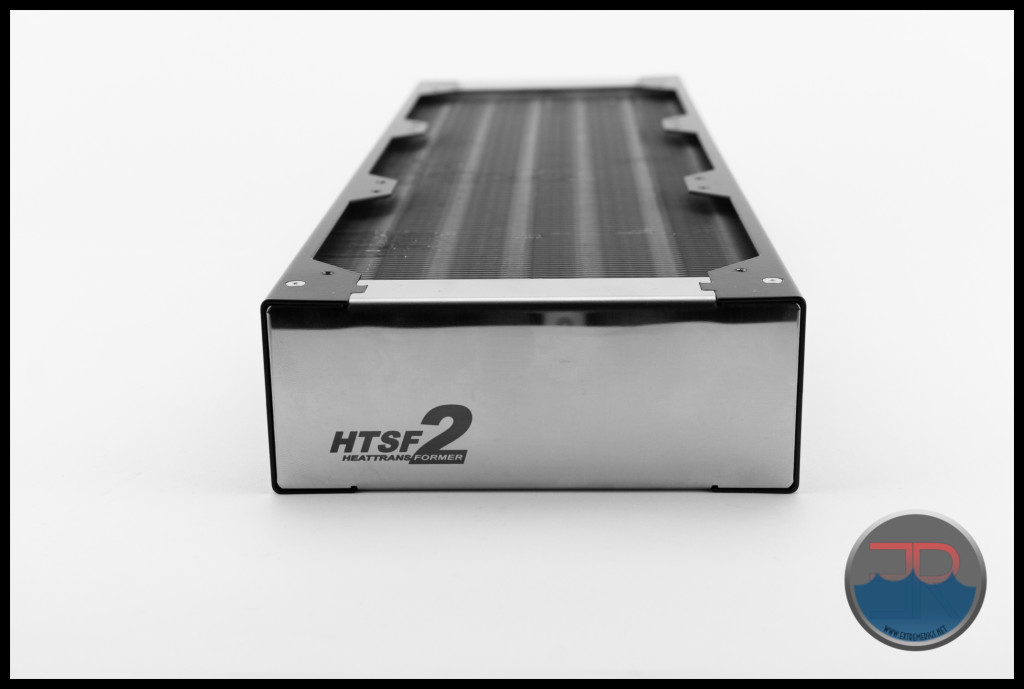
Watercool have chosen to use stainless steel for the housing enclosure panels. The side panels are powder coated in black for a smooth and durable finish. The two end pieces are mirror polished with the non-port end piece having the model laser engraved for a stylish finishing touch.
The whole unit feels solid despite have only 8 pop-rivets joining the panels to the core. Of the 15 rads in group 1 this is the rad which has the best finish and most appealing style. Hopefully it will perform as well as it looks.
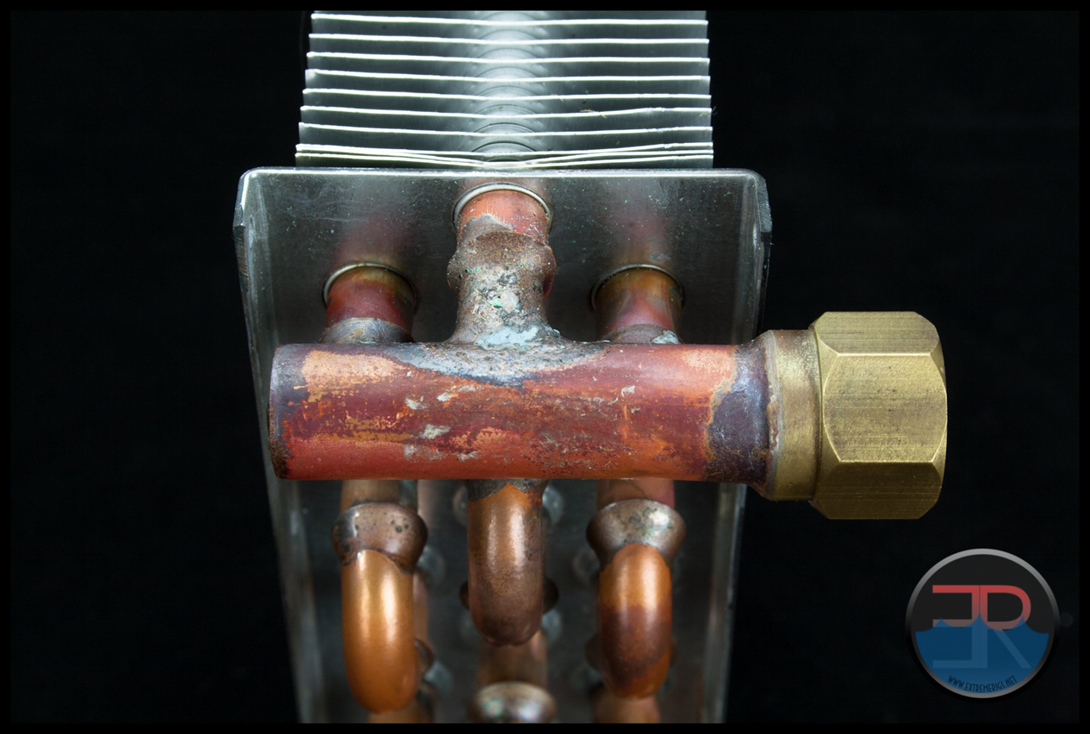
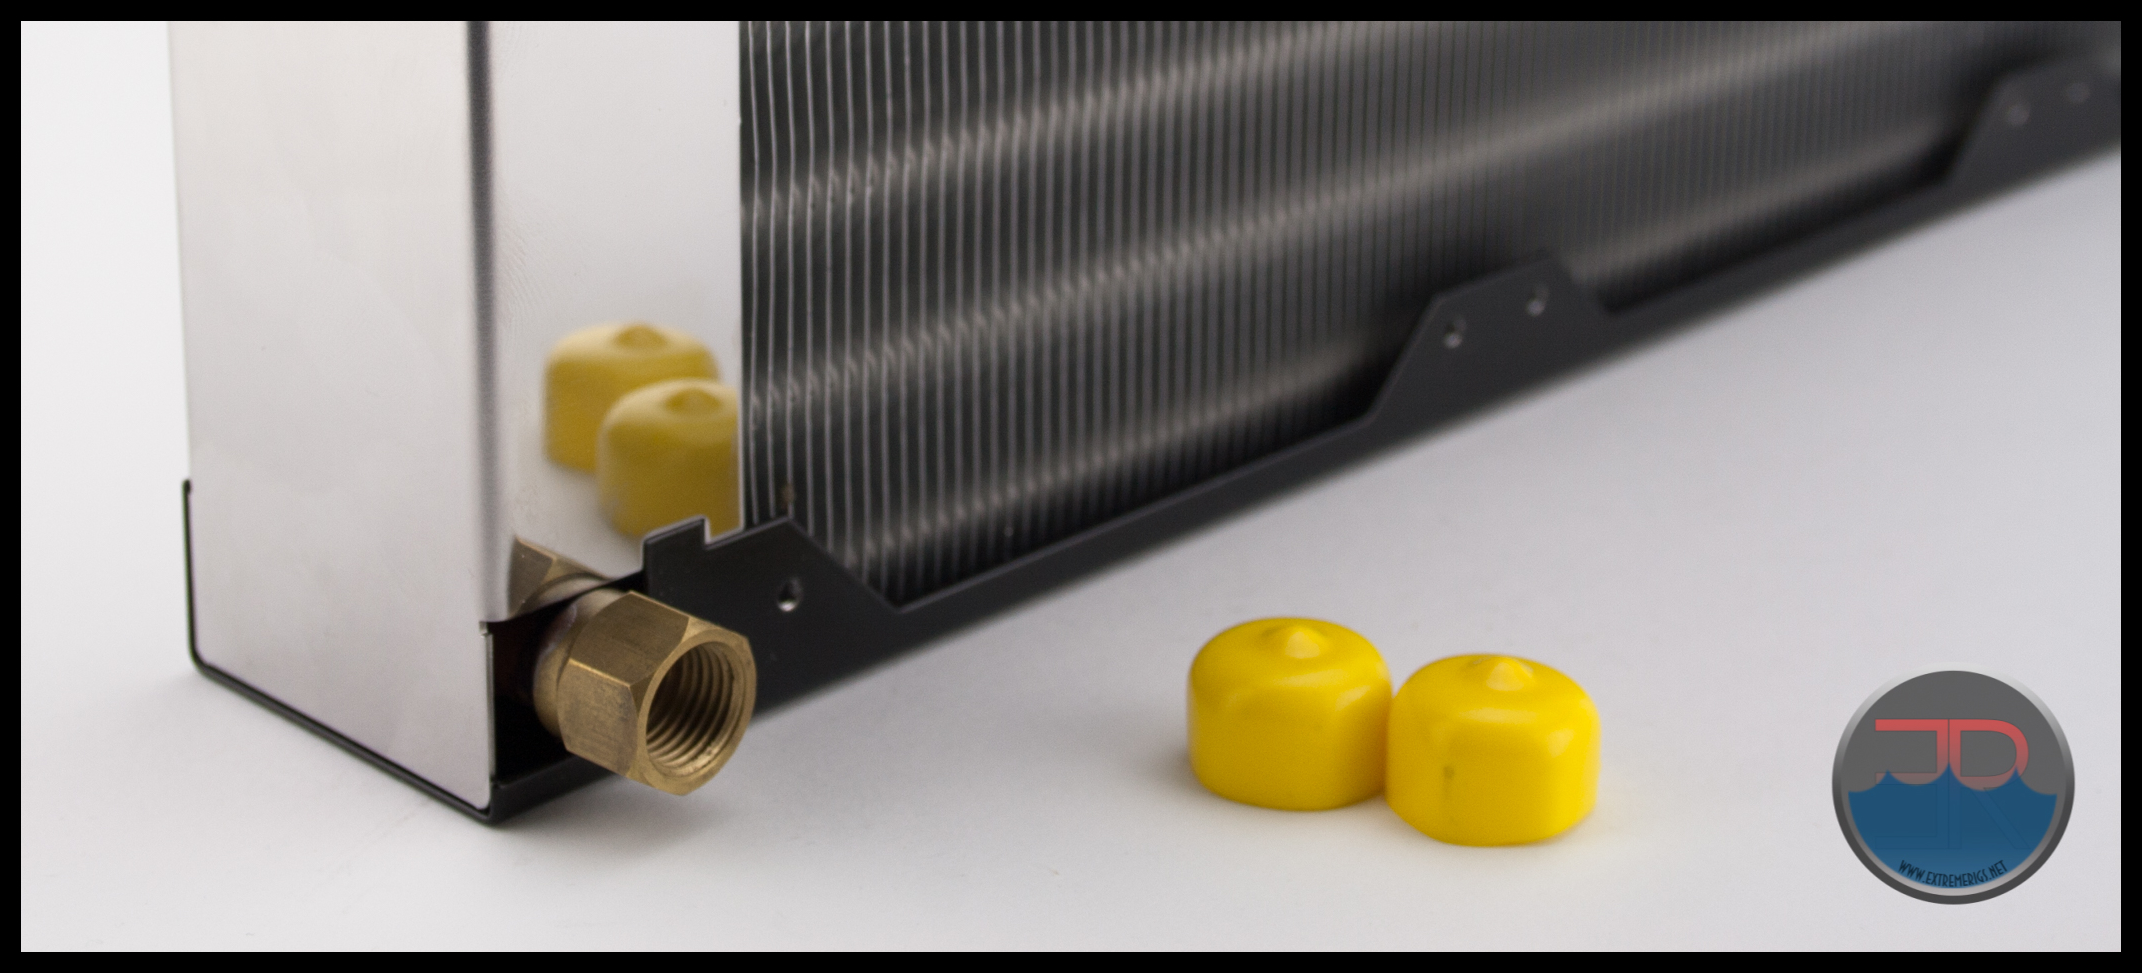
Two things did annoy me though, and both had to do with the brass ports. The brass ports had not been joined to the copper tubing squarely, resulting in the ports sticking out at a weird angle. I did manage to bend them straight with some brute force, but at was done with the risk of weakening the solder joints or worse, breaking the joint.
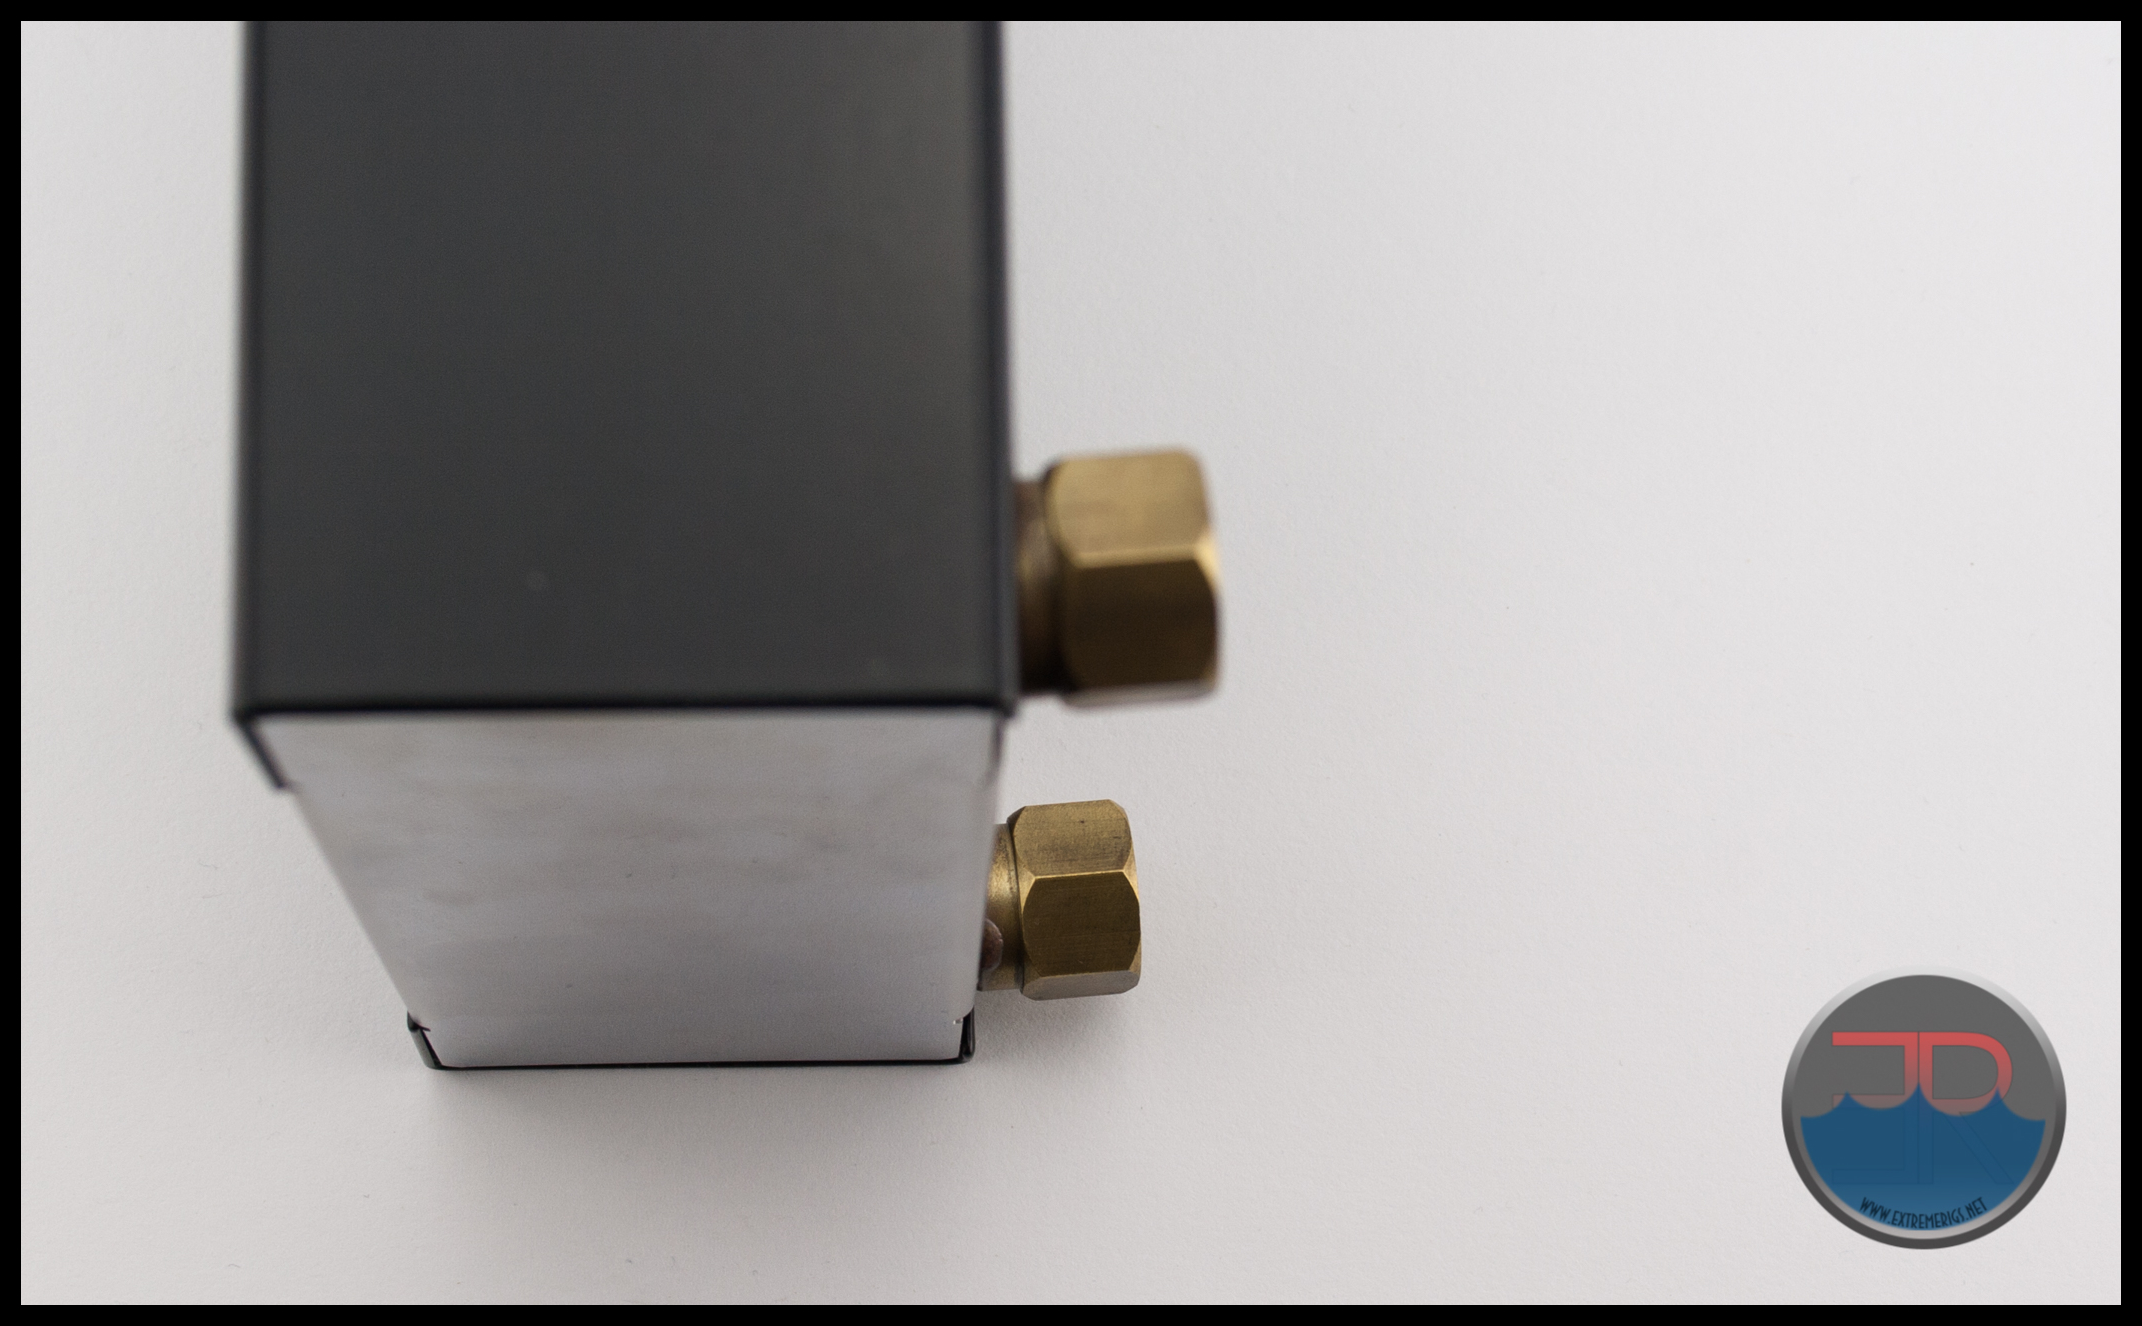
The other disappointment was how far out the brass G1/4 ports protruded from the radiator housing:
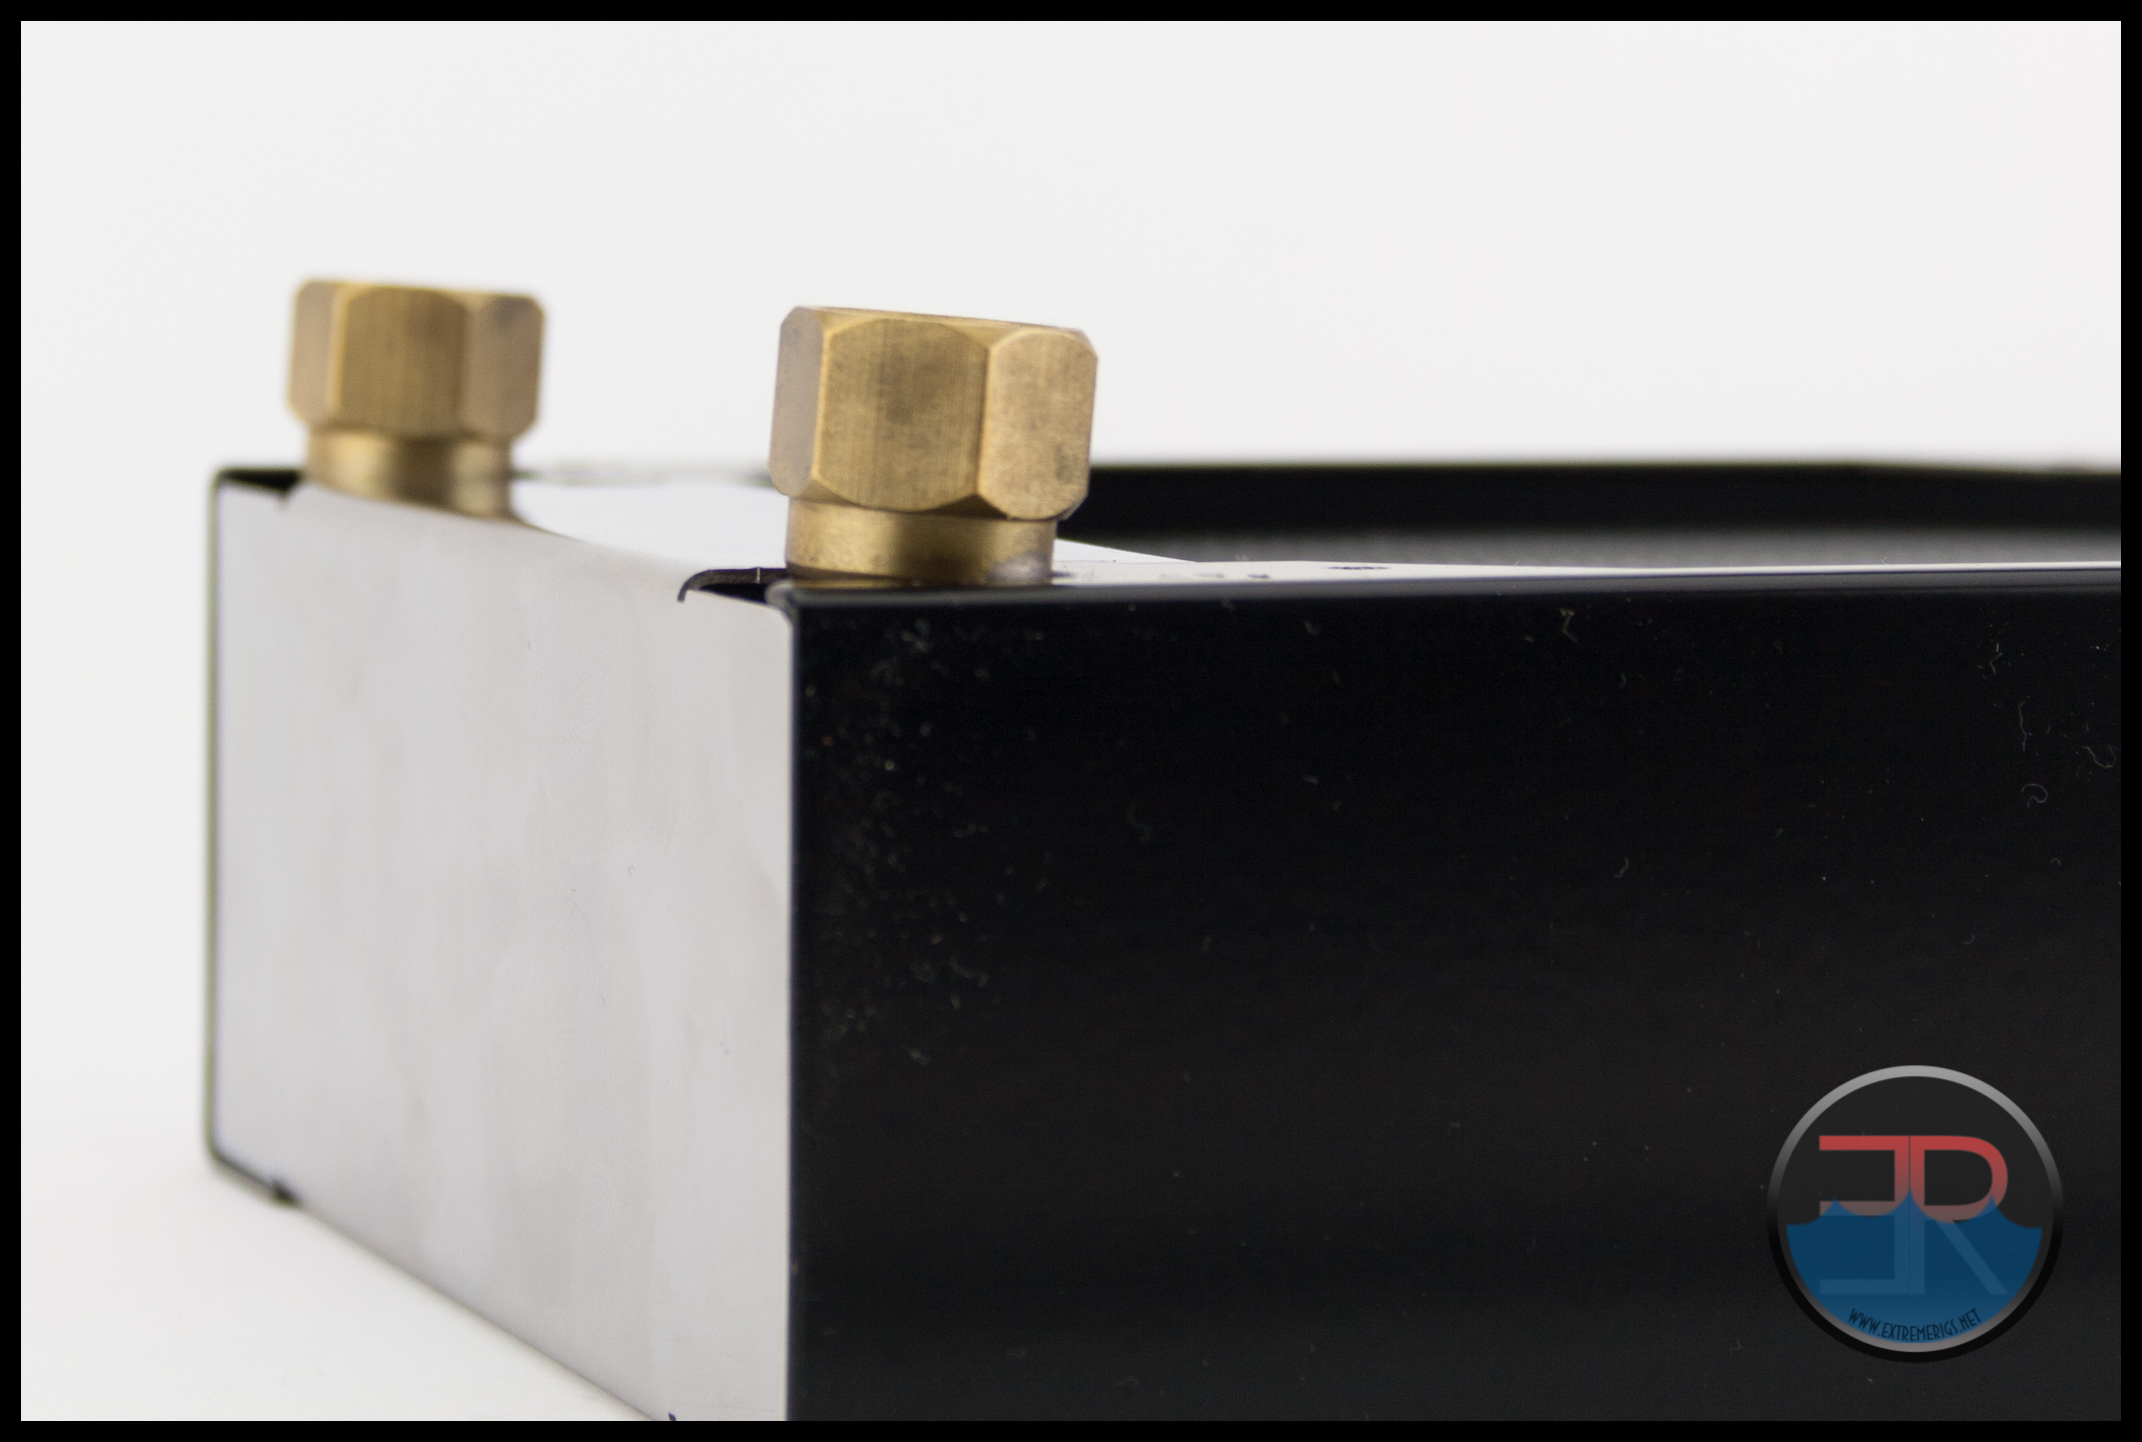
There are just the 2 ports on the HTSF2 III, inlet and outlet. There are no alternative port options or a bleeder/fill port on the return tank. This is of course due to the hex pass nature of the design.
Let’s see how it performs…
Flow Performance
The Data
As all the testing in this round up was performed with the exact same equipment, using the exact same methods I have decided to keep each radiators page uncluttered by posting our testing methodology, test set-ups and equipment used in a single location. To see exactly how the tests were carried out, details of the test set ups and equipment used, please head back to the RRU’15 Test Equipment Page.
Restriction Test
It’s generally agreed that radiators are one of, if not the least restrictive components in the water cooling loop. There are some exceptions however, so this must still be verified through testing:
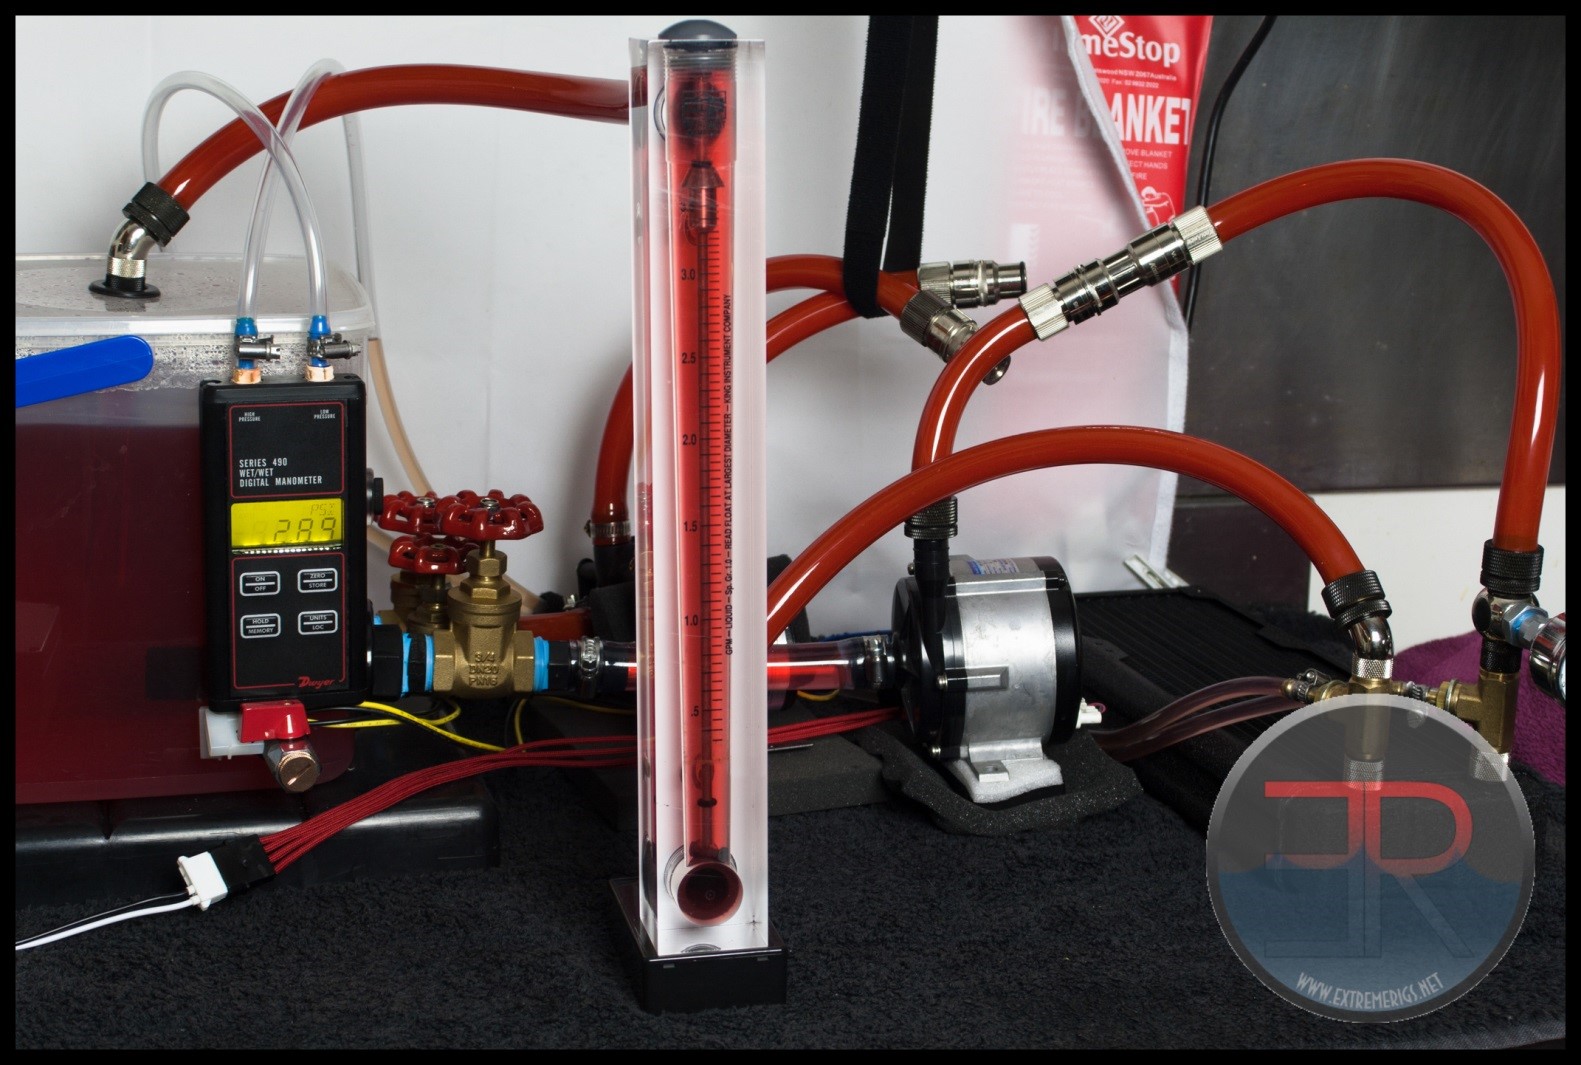
Note: The picture above of the test set-up is for reference only, the HTSF2 is not loaded so please disregard the readings.
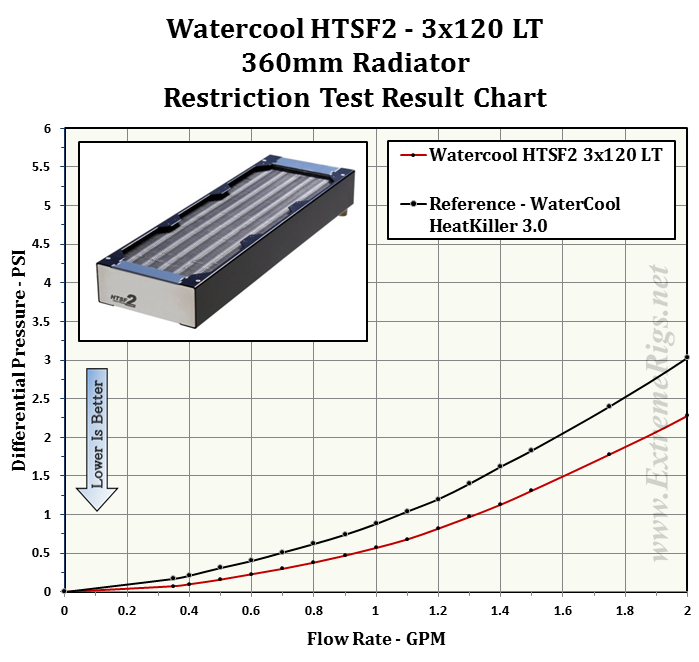
Here is the raw data at the tested flow rates, displaying the measured Differential Pressure across the radiator as flow rate was increased.

The table numbers indicate that the HTSF2 is a high restriction radiator. However numbers in isolation can only tell half the story. By plotting against other components it more easily shows the whole story. I have decided to use a HeatKiller 3.0 CPU block as the reference in these plots for two reasons. Firstly there is no chance of the plot being cluttered by curves overlapping and secondly it gives a reference point against a fairly common loop component of average restriction. For radiator to radiator restriction comparisons please see the RRU’15 data pages. As with all the radiator restriction plots I have limited the maximum flow rate displayed to 2.0 GPM as I suspect there are very few systems that operate above 2.0 GPM. For more information on how to read a restriction plot check out our guide.
Now that we have a feel for how the HTSF2 performs vs flow we can take a few of those data points and compare to the other radiators.


The Watercool HTSF2 is a high restriction radiator so adequate pump power would be needed to allow installation of multiples of this radiator into a loop without having any significant impact on the flow rate.
Onwards to Thermal Performance!
Thermal Performance
The Thermal Data
Moving on from the restriction test bench the HTSF2 radiator was loaded into the thermal test chamber for a series of 9 tests – consisting of 3 flow rates, each having 3 different fan rpm rates tested. I felt the thermal test data was most important and which you as the reader would be most interested in.
Below is the final data results gathered from at least 2 data logging runs at each flow rate and fan rpm combination. The most stable 15 minute period from each logging run was used and then averaged with the other runs to obtain the data for the table below. A total of 16 temperature sensors were used in the thermal test chamber (8 air in, 2 air out, 3 water in, 3 water out) each take a reading every second and logged via a CrystalFontz unit. The data in the table below is the result of the logging runs which has then been used to create all the plots and tables there-after.
The performance metric of critical importance is the delta between the warm coolant temperature in and the cold ambient air temperature in to the radiator. Given that the system is well insulated and in equilibrium and we know the heat input to the system then we can also calculate a very important number – that is the amount of power required to raise the coolant temperature 1C (or 10C which is more useful reference point).

Like the vast majority of the other radiators tested, the SR1 cares little about flow rate for performance, particularly above 1.0GPM. Here are some plots to show the variance:

So the performance is not greatly affected by varying flow rate. However Delta T is not always helpful when thinking about how many radiators you would need to cool your system. Instead it’s more useful to know the delta/W, or more usefully, the inverse metric of W/delta C.
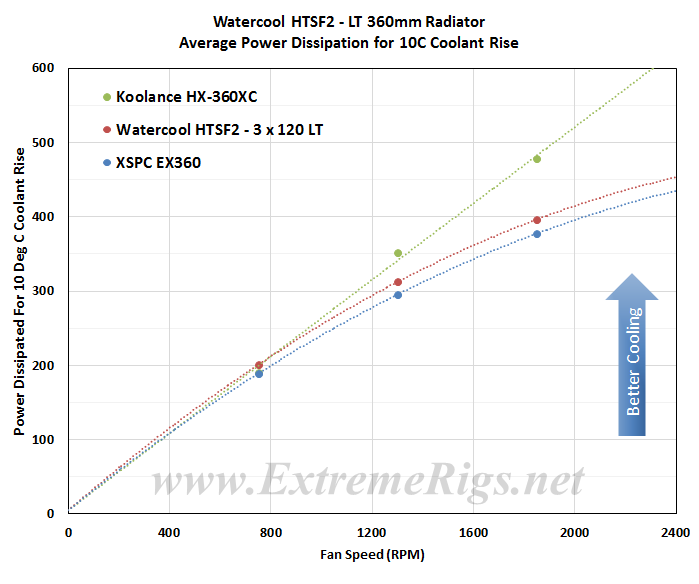
The metric plotted below tells us how many watts are dissipated by the radiator when the coolant rises 10C above ambient temperatures. (10 Delta T):

As expected increasing fan speed and therefore airflow through the radiator is the primary determinant in changing the radiators performance. This data can now be plotted as a pretty curve so that an end user can interpolate their own fan speed. Note again that the extrapolation of the curve is much more sensitive to error than in between the tested range.

This makes it easier to see that at higher fan speeds that a low flow starts to impact the cooling performance. This makes sense if you take it to the extreme and think about a very low flow rate where the coolant is already cooled 99% of the way to ambient with 10% of its journey through the radiator. In this example the radiator is not being efficiently used. 90% of the radiator surface area would then be wasted and you could have used a smaller radiator.
Having said all of this in this next plot all three push/pull flow rate results were averaged together to produce one curve. This works well because the radiator was so flow rate insensitive. Averaging reduces test error of course so this helps further to be sure of our data and is more useful therefore for comparing to other radiators.
Finally let’s take a look at push vs push/pull:

Push/Pull has very little gain as you might expect with a radiator that has such a low air restriction.
Now let’s analyze that data.
Data Analysis
Using the data compiled from the HTSF2 thermal testing I have compiled the following tables in an attempt to show another way how the HTSF2 performance varies against itself at the flow rates and fan speeds tested. Let’s first look at the raw W/10DT data we will be using for this:

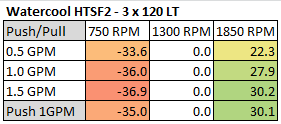
Effectively these show percentage gains relative to a reference point. It’s an interesting way to show gains/losses while changing a variable. This first table shows performance gain or loss relative to 1.0GPM flow rate:

This shows that increasing flow to 1.5GPM has less gain than lowering flow to 0.5GPM.
We can also focus on 1300RPM as our reference and see how much gain or loss in performance we get by changing fan speed:
As expected the change is dramatic.
The next plot references 0.5gpm & 750rpm and is quite effective at showing performance gains against our lowest and slowest test point.

Both this and the next plot are showing the same data but with different reference points. They try and give an indication into the tuning of the radiator and how air flow and coolant flow are linked. If you raise one high enough you will be limited by the other. This plot uses the 1300 RPM and 1.0 GPM as our reference point to show both effects concurrently:

So from the data above we can get a very good idea of how the HTSF2 radiator performs relative to itself. But there is a large selection of 360mm radiator models to choose from, released from numerous manufacturers. So, we need to start comparing performance between them. To see how the radiator performed against the other radiators in this group I have included the averaged flow rate comparison charts from the Round Up. We know that the flow rate has little impact on thermal performance so averaging of the 3 flow rate results gives us a good look at head to head performance at the rpm speeds tested at with even less error.
Let’s start off with the Push only data:

At 750RPM the HTSF2 is starting off strong. Clearly this radiator with it’s low FPI and tube structure is optimized for low airflows.

By 1300 RPM it’s already dropped off to the middle of the range.

Surprisingly at 1850RPM it still holds strong in the middle of the pack.
Now let’s look at push/pull – an area that we would expect other radiators to do better with:

This time the HTSF2 starts off in the middle of the pack.

1300RPM turns in the HTSF2’w worst performance so far. It is firmly below average now.

Again at 1850RPM it holds it’s ground.
If we select only 1GPM flow rate data then we can combine push and push/pull data on the same plots. In order to make this less confusing we use different colors to represent push and push/pull:

At 750RPM the HTSF2 in push is already beating several push/pull setups.

At 1300RPM not much changes, the worst push/pull setups are still much worse than the HTSF2 in push, while the leading push radiator has just overtaken the HTSF2 in push/pull.

At 1850RPM the trends continue with more overlap still.
From all of these results we can create a “master performance factor”. The radiator with the best cooling ability (W/10ΔT) at each gpm/rpm combo was awarded a score of 100, and each other radiators W/10ΔT result was scored as percentage of the top performer:

From this we can see that the HTSF2 performed best (comparatively) at the lowest fan speed, falling further behind as the fan speed increased. In addition it seems to be quite sensitive to flow rate in comparison to other radiators. This is surprising given how restrictive the radiator is – usually a restrictive design is made to work well at low flow rates.
Then all these percentage scores were averaged giving us the Averaged Performance Factor of each radiator. This way of looking at the comparison takes away any advantages that a radiator may have at higher or lower fan speeds and looks at an overall average. While this appears fair it does tend to favor those radiators that are all rounders and those radiators which do very well at high RPM. Most users should be more focused on their specific use case. Check in the Round Up for performance comparisons at every gpm/rpm combo for even more details and cross comparison results.
First off again is the push only average results:

The HTSF2 scored well, getting a 91.3 and coming in 9th overall. To be honest given the non-standard tube design we were almost surprised it scored this high.

In Push/Pull of course the radiator faired worse. However it still performed decently and came in solidly in the middle of the pack. Not bad for a medium thickness radiator designed for low speed fans.
Next up – Summary!
Summary
Push Performance – 3.5/5
Push/Pull Performance – 2.5/5
Overall Performance – 3/5
The HTSF2 is too biased towards low fan speed setups to perform well overall. However it’s average performance was still respectable as the radiator still scales quite well with higher airflow.

The restriction level was high so installing multiple HTSF2 radiators in a loop would require adequate pump power, especially as the thermal results were worse with lower flow rates.
 Features & Quality – 4/5
The Watercool HTSF2 has the best finish of all the radiators in the test group. The polished stainless steel end tanks and powder coated side panels give it a distinctive and stylish look. The core was well constructed with even fin placement down the tubes on the finned tube style core.
The fitting of the ports was the only let down as they were not fitted squarely and pointed out at an unusual and unsightly angle. The design meant that the ports protrude a significant amount from the radiator housing.
Due to the core design and coolant flow path, alternative inlet/outlet ports are not fitted, nor is a bleeder/fill port at the return end. The hex pass design also means that coolant will be exceptionally hard to drain out.
Summary – 3.5/5
The Watercool HTSF2 LT is a premium priced radiator being the most expensive by far in the test group. For that money you get precision German engineering and European manufacturing which oozes style and not some stamped out made in China clone. Unfortunately the core design, stylish as it is, does not translate to great thermal performance. It is a restrictive radiator also. Relative performance may improve in push or pull only fans, but with push&pull fans as tested, the HTSF2 fell short of the mark on performance.
Where to buy: PPCS – $130-142


[…] Watercool HTSF2 3×120 LT 360 Radiator Review […]
[…] for both Push/Pull and Push Only fan installations. The similarities between the Phobya HPC and WaterCool’s HTSF2 LT radiator are obvious. There are a few subtle differences between the two, so I will likely make […]
Comments are closed.